
The pair consolidated its price action around the 200 SMA at H1 chart at the end of the week and it's looking for catalysts that help to push higher the price towards the resistance zone of 1.2826. However, as the bias is still bearish and pointing to the south, we could take this opportunity as a sell and eventually, GBP/USD could be back to test the support area of 1.2652.
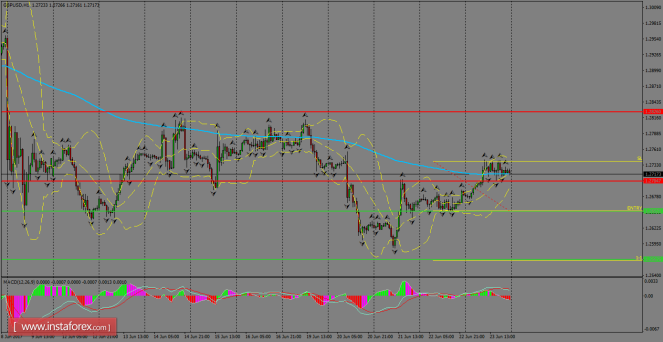
H1 chart's resistance levels: 1.2704 / 1.2826
H1 chart's support levels: 1.2652 / 1.2567
Trading recommendations for today: Based on the H1 chart, sell (short) orders only if the GBP/USD pair breaks a bearish candlestick; the support level is at 1.2652, take profit is at 1.2567 and stop loss is at 1.2739.
The material has been provided by InstaForex Company - www.instaforex.com