
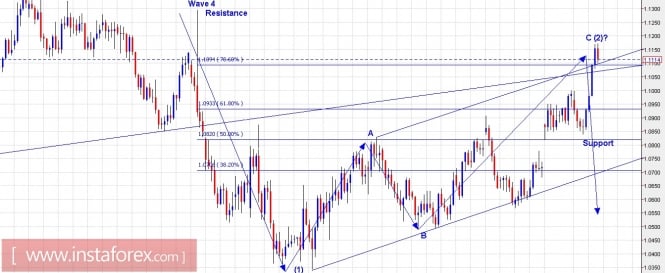
Technical outlook:
The EUR/USD pair continued to probe higher highs yet again taking stops out above 1.1122 levels. Nonetheless, the wave structure still looks unchanged as depicted on a Daily chart here. The story begins from November 08, 2016 highs made at 1.1300 levels. The entire drop through 1.0350 levels can be still labelled as wave (1). After witnessing a number of alternative counts, the corrective wave (2) has unfolded as a complex A-B-C as shown above. Please note that the alternative label could be W-X-Y as a combination (not shown here). Besides, the pair is finding three resistance zones at this moment: The fibonacci 0.786 levels, channel line resistance, and support turned a resistance trend line. A bearish signal confirmation here should be considered as a selling point with risk above today's highs.
Trading plan:
Remain flat for now and go short again on bearish signal confirmation. Aggressive traders may go short, stop above today's highs and target lower.
GBPUSD chart setups:
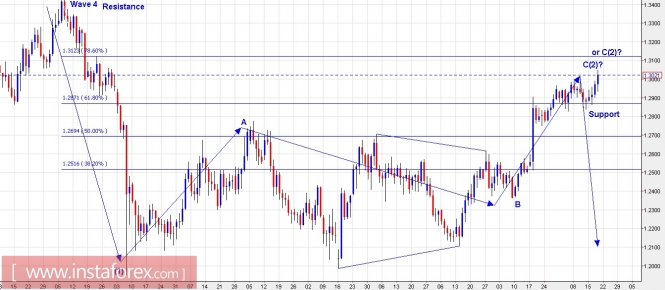
Technical outlook:
The GBP/USD pair has also rallied higher seeking resistance and looks like it has already met with today's highs being printed at 1.3040/45 levels. The wave count suggests that waves (1) and (2) are ready on the larger time frames or probably one last high may be printed at 1.3100 levels before reversing, chances are fewer though. A bearish reversal now would still keep the bearish wave structure intact and one can expect prices to drop towards 1.2000 and lower in the coming weeks. Only if GBP/USD rallies to greater highs above 1.3100 levels, the matter would be further delayed. Resistance should be strong around 1.3100 levels, while immediate support is seen at 1.2935 levels. A break below support here would confirm that a meaningful top is in place and accelerate drop.
Trading plan:
Please look to go short on bearish signal with stop above 1.3100 levels, targeting 1.2300 and lower.
Fundamental outlook:
Watch out for Draghi's speech today around 01:00 pm est for a bit volatility in EUR/USD.
Good luck!
The material has been provided by InstaForex Company - www.instaforex.com