
USDX is piercing the support level of 99.23, which means a further consolidation below the 200 SMA on H1 chart. However, the overall picture remains bullish, as long as the index holds the lows from May 8th. The current move should be taken as a corrective one in favor of the bulls, but a continuation lower can produce a decline to test the 98.77 level. To the upside, the key resistance is at the 99.63 level.
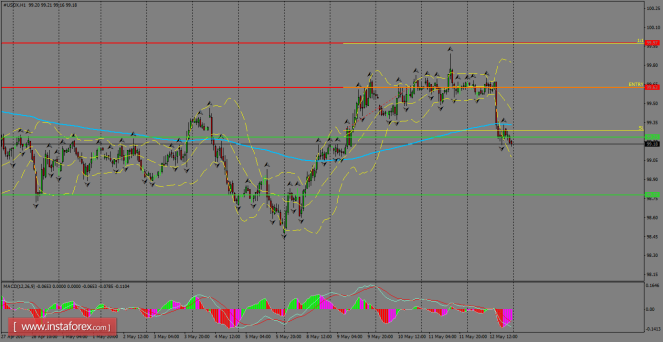
H1 chart's resistance levels: 99.63 / 99.97
H1 chart's support levels: 99.23 / 98.77
Trading recommendations for today: Based on the H1 chart, place buy (long) orders only if the USD Index breaks with a bullish candlestick; the resistance level is at 99.63, take profit is at 99.97 and stop loss is at 99.28.
The material has been provided by InstaForex Company - www.instaforex.com