
Technical outlook:
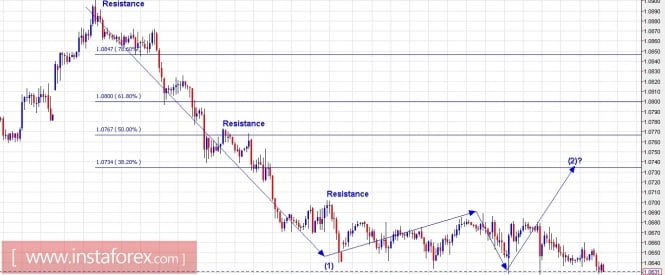
The EUR/USD pair continues to drift sideways for now trading at 1.0630 level. Please note that a minimum retracement is seen at Fibonacci 0.382 resistance which is passing through 1.0730/40 levels as presented here on the 4-hour chart. The pair has kept us waiting for the entire week for a counter trend rally which could be labelled as wave (2), within the (5) waves drop towards parity levels. The wave structure indicates that the EUR/USD pair has dropped 5 waves from 1.0906 level on March 27, 2017, labeled as wave (2) and a push higher towards at least 1.0730/40 levels could complete termination of wave (2). Please also note that potential remains for an extended rally through the Fibonacci 0.618 resistance towards 1.0800 level as well before turning lower. On the flip side, a sustained drop below 1.0628 level would indicate that wave (2) is already in place at 1.0690 levels and that the pair should drift lower from here. Immediate resistance is seen at 1.0690 level, while support is at 1.0628 levels respectively.
Trading plan:
Please look to sell intraday rallies through 1.0740 and 1.0800 levels, stop is at 1.0906, and target is at 1.0300 and lower.
Gold chart setups:
Technical outlook:
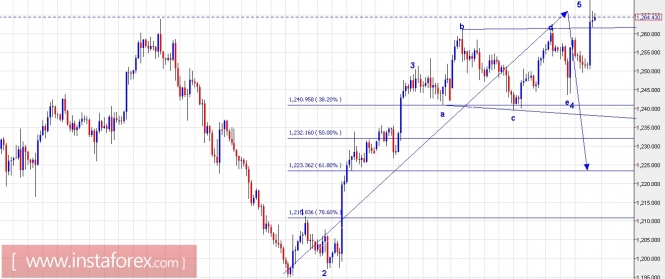
Gold has stopped us out today at $1,262/63 and made intraday highs at $1,269 level before dropping lower. The structure could be still labeled as 5 waves complete from $1195 levels. The push today morning can be considered as a final thrust 5th wave after the triangle formation as labeled here as a,b,c,d,and e. If the above wave count holds to be true, the metal should drop lower in 3 corrective waves A-B-C, towards $1,223 at least. On the flip side, a push through $1,270 would open doors towards $1,285 level, which is less probable though. An alternate way to label the above chart is a possible ending diagonal as well, which is not shown here. But in either case, please watch out for a bearish reversal towards $1,223 level from here. A break below $1,245 would confirm that a meaningful top is in place. Immediate resistance is seen at $1,269 level, while support is at $1,245 level respectively.
Trading plan:
Please sell again at current price, stop is at $1,272, and target is at $1,223.
Fundamental outlook:
Please watch out for Non-Farm Payrolls to be out at 08:30 AM EST today for some volatility ahead. This could prove to be a good trigger for counter trends to materialize.
Good luck!
The material has been provided by InstaForex Company - www.instaforex.com