Trading plan for 13/04/2017:
The US Dollar and US bond yields tumbled on Wednesday evening in response to President Donald Trump's interview when he said that the Dollar is too strong and that he prefers low-interest rates. Geopolitical risks around North Korea remain in place, which is supported by nervous trading in the equity market. Gold is soaring, oil is in a correction mode. Chinese Shanghai Composite grows by 0.2% due to better trade data. The Japanese Nikkei dropped 0.6% today, followed by USD/JPY.
On Thursday 13th of April, the event calendar is not that busy with important news. Nevertheless, global investors will keep an eye on Bank of England Credit Conditions Survey data, Manufacturing Sales and New Houses Price Index data from Canada and PPI, Unemployment Claims and Prelim UoM Consumer Sentiment data from the US.
GBP/USD analysis for 13/04/2017:
The BoE Credit Conditions Survey data are scheduled for release at 08:30 am GMT. This survey for bank and non-bank lenders is an input to understand trends and developments in credit conditions in the UK. If the secured and unsecured lending to households, small businesses, non-financial corporations, and to non-bank financial firms is increasing, then the economy is expanding.
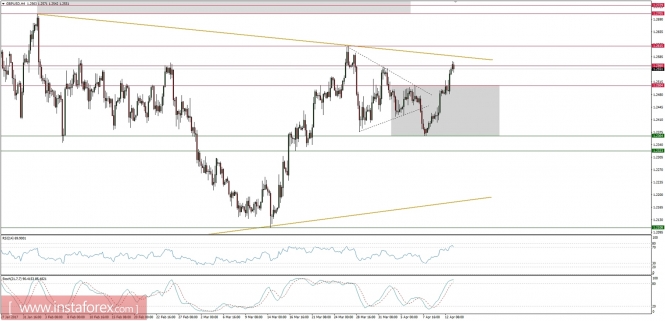
Let's now take a look at the GBP/USD technical picture at the H4 timeframe. The market is trading just below the golden trendline resistance around the level of 1.2560. The market conditions start to look overbought, so any data worse than expected will act as a trigger for a correction towards the level of 1.2505.
USD/CAD analysis for 13/04/2017:
Canada's Manufacturing Sales and New Home Price Index data are scheduled for release at 12:30 pm GMT. The Manufacturing Sales are expected to decrease -0.4% from 0.6% a month ago and New Home Price Index is expected to increase from 0.1% to 0.2%. Higher housing prices suggest stronger consumer demand and growth in the housing market, but the recent house price data from Canada, especially from Toronto area, might suggest that there is a growing house market bubble in progress.
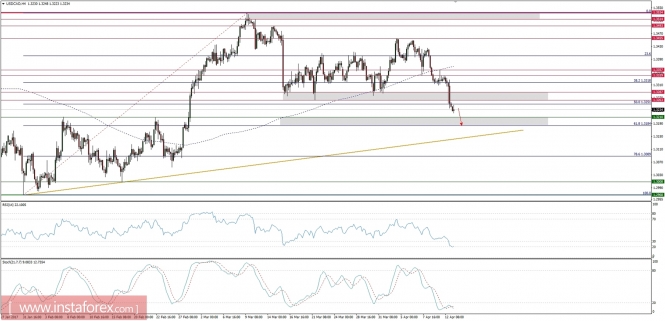
Let's now take a look at the USD/CAD technical picture at the H4 timeframe. The market is approaching the 61%Fibo at the level of 1.3184. The market conditions are starting to look oversold, but there is still no bearish divergence visible on momentum oscillator. The next technical support is seen at the level of 1.3210.
EUR/USD analysis for 13/04/2017:
The US PPI, the Unemployment Claims, and Prelim UoM Consumer Sentiment data are scheduled for release at 12:30 pm GMT. The situation on the US job market is still good, so the Unemployment Claims data are expected to hold the level of 242k after the last week reading of 230k. The sentiment indicator which is a measure of attitudes and expectations concerning both present and future economic conditions of 500 consumers, is expected to tick upward to the level of 97.1 points from 96.7 a month ago. The most important, however, is the PPI index, that is expected to decrease from 0.3% to 0.0% o a monthly basis. Any data lower than 0.0% would suggest the start of no inflationary pressure from producers.
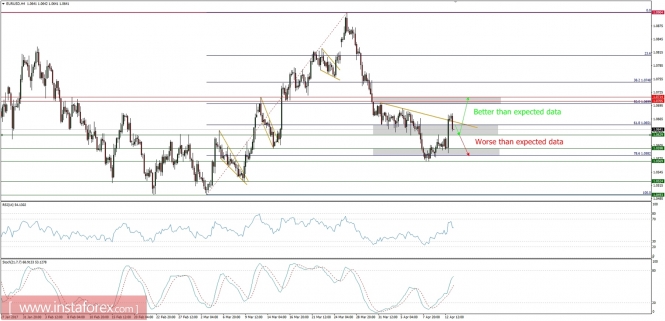
Let's now take a look at the EUR/USD technical picture at the H4 timeframe. The bulls have managed to break out above the golden trend line but were capped around the level of 1.0678 and now the market is moving back to the trading range. The next support is seen at the level of 1.0629 and any bounce above this level, triggered by better than expected data, might reach the next technical resistance at the level of 1.0705.