
Trading plan for 05/04/2017:
The currency market remains in tight fluctuations waiting for important events in the second part of the week (FOMC minutes, NFP, and Trump-Jingping meeting). Return to Chinese investors after a long weekend sustains the stock market in Asia, but the risk appetite is weak. Oil is supported by a better API report. The French presidential debate has not brought the euro's reaction.
On Wednesday 5th of April, the event calendar looks busy and the global investors will pay attention to PMI Services data from the UK, PMI Services and Composite data from across the Eurozone, ADP Non-Farm Employment Change and ISM Non-Manufacturing PMI data from the US. Moreover, the FOMC Meeting Minutes will be released later on the day.
EUR/USD analysis for 05/04/2017:
The PMI Services and PMI Composite data will be released during the early London session between 07:00 - 08:00 am GMT. The global investor's consensus forecast sees the Composite PMI holding at 56.7 for March, matching the flash estimate that was previously published, which means the projected 0.6% growth for GDP in Q1 (via the PMI data) will also hold steady.
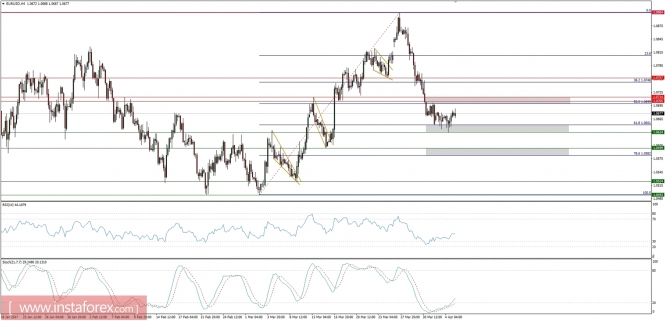
Let's now take a look at the EUR/USD technical picture at the H4 time frame. The bears have managed to retrace 61% of the previous swing up and due to the oversold trading conditions the price is now bouncing from the support zone between the levels of 1.0634 - 1.0651. The next immediate resistance zone is between the levels of 1.0699 - 1.0714, so only a clear, sustained break out above this level, triggered by better than expected PMI data, would allow the bulls to test the next technical resistance at the level of 1.0757.
GBP/USD analysis for 05/04/2017:
The PMI Services and PMI Composite data are scheduled for release at 08:30 am GMT and the market participants expect both of the indices to remain unchanged at the levels of 53.5 and 53.8 respectively. The trend in services and manufacturing remains above the 50 points level, so despite the Brexit vote and the recent start of the Brexit procedure is still being perceived as positive. If the data beat the expectations, the British Pound will likely rally all across the board.
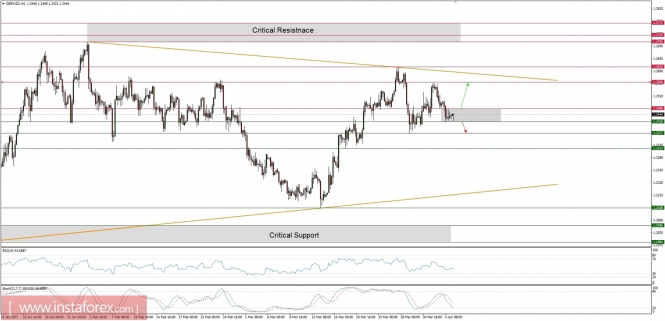
Let's now take a look at the GBP/USD technical picture before the data are released. The market keeps trading inside of a tight horizontal range between the levels of 1.2418 - 1.2466 which possibly means it is waiting for the fundamental trigger to break out in any direction. Better than expected data will make the GBP rally towards the level of 1.2560, worse than expected data will likely make this pair to test the technical support at the level of 1.2377.
US Dollar index analysis for 05/04/2017:
Two important data releases from the US are scheduled for today: ADP Non-Farm Employment Change at 12:15 pm GMT and ISM Non-Manufacturing PMI at 02:00 pm GMT. The market participants expect a substantially softer increase in new jobs: 170k in March, down sharply from 298k in February. The ISM expectations are a little softer as well, the market participants expect the index to decrease from 57.6 points to 57.0 points. Nevertheless, the setback will leave this benchmark for the services sector at its highest level in 16 months and well above the neutral 50 mark. Any data better than forecast will make the US Dollar to advance against its counterparts.
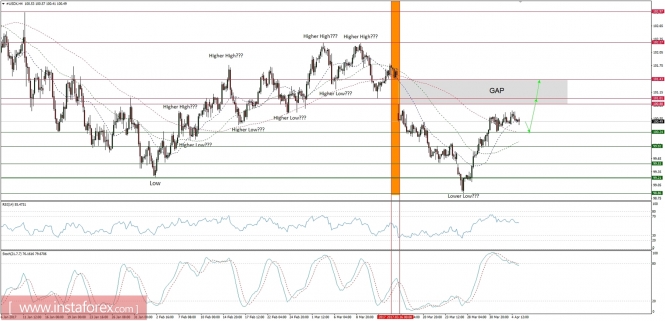
Let's now take a look at the US Dollar index technical picture at the H4 time frame. After making the lower low at the level of 98.86, the index rallied towards the unfilled gap between the levels of 100.88 - 101.43. The trading conditions look overbought, so a corrective cycle towards the level of 100.24 might be seen before the bulls will either give up or try to fill the trading gap (aiming at the level of 101.43 min.).
from www.instaforex.com