
Despite the strong decline lived during Wednesday's session following Trump's comments on the greenback, USDX recovered from the lows posted after the headlines were reported to the press and now it's consolidating around 100.54, where it's located the 200 SMA at H1 chart. If the index does a breakout above 100.60, then it can test the 101.00 psychological area.
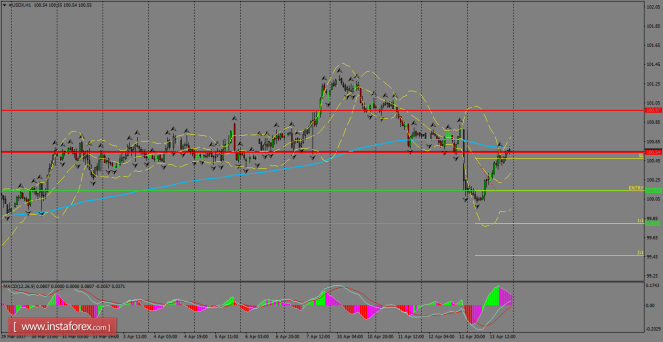
H1 chart's resistance levels: 100.54 / 100.97
H1 chart's support levels: 100.14 / 99.79
Trading recommendations for today: Based on the H1 chart, place sell (short) orders only if the USD Index breaks with a bearish candlestick; the support level is at 100.14, take profit is at 99.79 and stop loss is at 100.47.
The material has been provided by InstaForex Company - www.instaforex.com