
GBP/USD still struggles to consolidate below the 1.2300 handle, as we saw during Monday's session a recovery move to the upside, in an effort to reach the 200 SMA at H1 chart. That level remains as dynamic resistance across the board and if the pair tests it, then we could expect further pullbacks to take place toward the 1.2333 level. To the upside, the target lies at the 1.2488 zone.
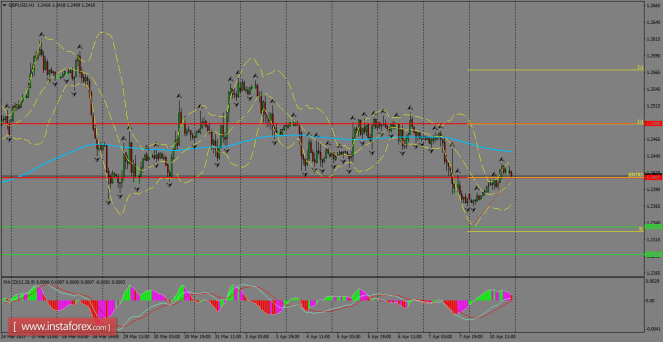
H1 chart's resistance levels: 1.2407 / 1.2488
H1 chart's support levels: 1.2333 / 1.2292
Trading recommendations for today: Based on the H1 chart, buy (long) orders only if the GBP/USD pair breaks a bullish candlestick; the resistance level is at 1.2407, take profit is at 1.2488 and stop loss is at 1.2327.
The material has been provided by InstaForex Company - www.instaforex.com