
Gold price remains in a bearish trend. The daily chart is as oversold as when Gold was at $1,120. A bounce is justified and for the Gold market I expect the low will be today. Gold is most probably in wave 2 down retracing the rise from $1,120 to $1,263.
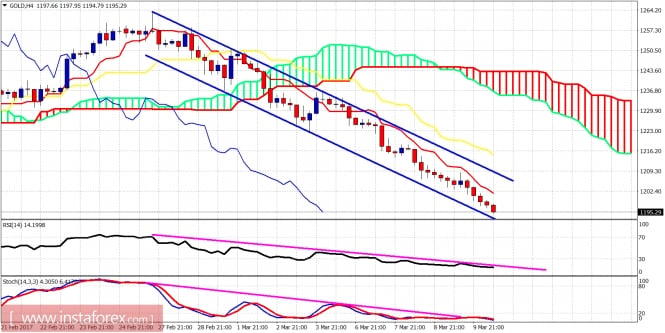
Purple lines - trend line resistance
Gold price is making lower lows and lower highs. The price is below the Ichimoku cloud and oscillators are oversold. Gold has short-term resistance at $1,202 and the next is at $1,208. $1,215 is the first strong short-term resistance and the most important one is at $1,237-40.
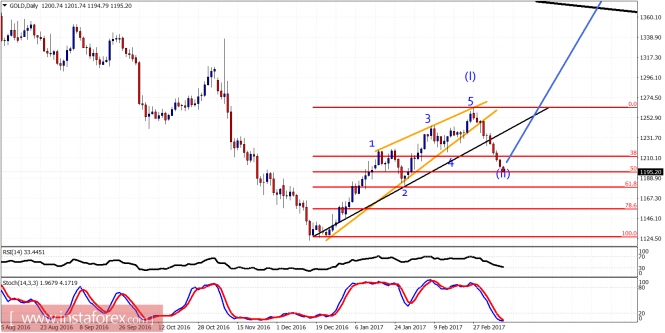
I believe Gold has formed a leading diagonal pattern as wave (I) and is now in wave (II) and has already reached the 50% retracement. A move below the 61.8% Fibonacci retracement will decrease the chances of this scenario being correct. In the long tern I remain bullish.
The material has been provided by InstaForex Company - www.instaforex.com