
Technical outlook:
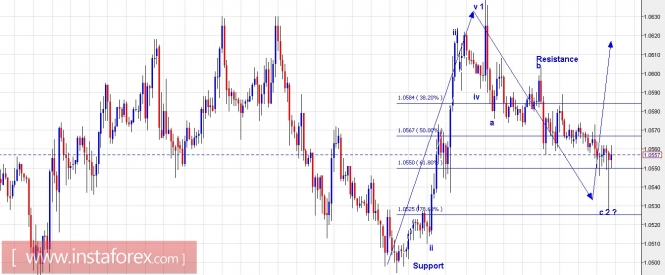
The EUR/USD hourly chart suggests that an intermediate bottom is formed around 1.0525 level just an hour ago during New York open. This move was bit anticipated and more fire works are expected tomorrow and day after. The wave structure still suggests that the pair is into its flat A-B-C, not shown here. To be precise, wave C is underway with waves 1 and 2 almost ready as labelled here. If the above wave count comes true, the pair should push higher from here producing wave 3, 4 and 5 at a lower degree to push through 1.0700 levels and reverse from there on. Please note that structurally EUR/USD is in a downtrend but might be producing a counter-trend rally which could be in its last leg. Immediate resistance is seen at 1.0600 while support is at 1.0494 levels respectively.
Trading plan:
Aggressive traders please remain long, with a stop at 1.0490 levels targeting 1.0650 and 1.0700 at least.
Conservative traders please remain flat for now and look to sell rallies through 1.0700 levels. The above plan is true for the next few days to 2 weeks time.
USD/JPY chart setups:
Technical outlook:
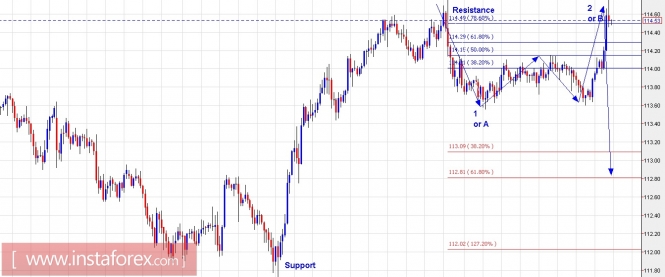
The USD/JPY pair has pushed slightly above our expectations today and has tested 114.75 as seen on the hourly chart above. A good thing is that is hasn't breached the same and hence it could still remain into guild lines of a potential wave 2 as labelled here. The wave structure still reveals that a reversal is in the action that could push prices towards 112.00 levels at least or a corrective drop A-B-C is in the action which should produce a correction towards 112.80 levels respectively. In either case, a top is very near and short positions are still favored against 115.00. Please note that the current structure could also fall under the presumption of a double top or it could produce an expanded flat. All probabilities are pointing towards a push lower from current levels either into 5 waves or as an A-B-C corrective drop.
Trading plan:
Please remain short for now with stop at 115.00 levels, targeting 112.00 levels.
Fundamental outlook:
Although the USD is strong across the board, a temporary corrective drop is in the making, which could last a couple of days or up to 2 weeks. Today's events are mostly out but watch out for tomorrow's ECB monetary policy decision. Check market updates tomorrow for more details.
Good luck!
The material has been provided by InstaForex Company - www.instaforex.com