
Technical outlook:
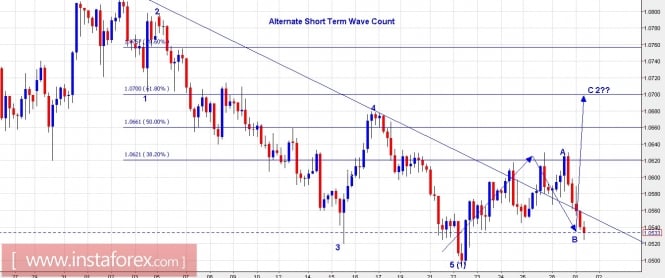
A 4H chart view has been presented here with an alternate wave count probability. The larger trend still remains down but an alternate scenario suggests that EUR/USD may produce a rally for short term towards 1.0700 level before conceding lower levels again. According to the previous recommended trading plans, the pair has acted well and short-term profits can be booked at these levels. The alternate wave count suggests that the entire drop from 1.0829 through 1.0492 level can be considered as wave (1), sub divided into 5 waves. Furthermore, the pair might have completed waves A and B within the A-B-C corrective waves. If the above wave count holds true, a rally could unfold towards 1.0680-1.0700 levels and terminate wave C, before reversing lower. Immediate resistance is seen at 1.0680 level, while support is at 1.0492 level respectively.
Trading plan:
Please take short-term profits on short taken earlier and remain flat. Aggressive traders may want to go long with a stop at 1.0490 and target 10680/1.0700 levels. Conservative traders please remain flat and look to sell on rallies.
USD/JPY chart setup:
Technical outlook:
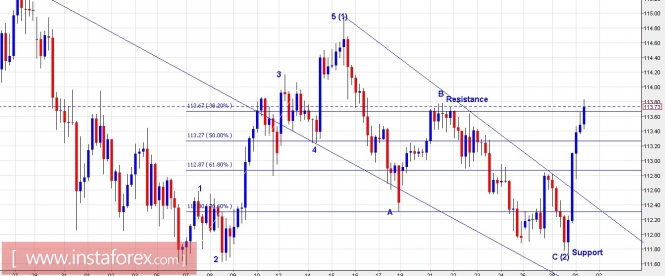
The USD/JPY pair has produced an impressive bullish recovery since last session and the 4H chart has been presented here for further wave count probabilities. It is more or less clear and confirmed now that the pair is into its wave (3) rally that could possibly extend towards 117.00 level. The A-B-C zigzag terminated its last leg yesterday at 111.70 level absolutely close to our stops but bounced back sharply since then. According to the wave counts, the pair has completed waves (1) and (2) since February 02, 2017 and wave (3) is underway now. Please note that the pair has taken out the first major resistance at 113.70/80 levels as seen here. A drop lower is expected for current levels before the rally could resume further. Strong support is seen around the 112.50/60 levels going forward.
Trading plan:
Please book short-term profits on the long positions taken earlier and remain flat for now. Please look to buy again on dips towards 112.60 level.
Fundamental outlook:
The USD was expected to gain momentum fundamentally as well as we have been discussing here and the host of past events has also been assertive of the same. Watch out for German Consumer price index scheduled at 08:00 AM EST and Bank of Canada Rate Decision (Unchanged at 0.5%) and USD ISM Manufacturing (FEB), slightly higher at 56.2 around 10:00 AM EST.
Good luck!
The material has been provided by InstaForex Company - www.instaforex.com