
The bearish scenario of the Head and Shoulders pattern is still valid, as long as the price is trading below 102.30. The Dollar index is mostly trading sideways between 102 and 100.50.
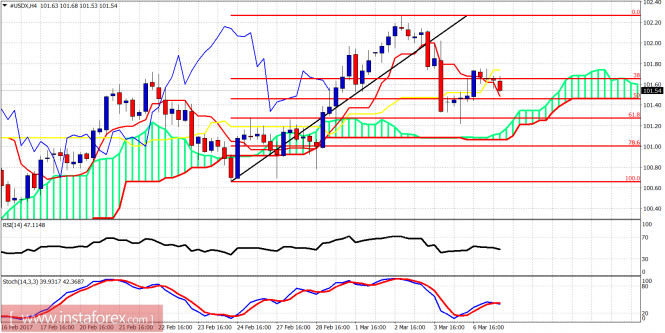
In the 4-hour chart the Dollar index is trading above the Ichimoku cloud and has already bounced off the 61.8% Fibonacci retracement of the latest upward move. These signs are bullish. Support is at 101.20 and as long as the price is above that level, the bulls will make another try to break above 102. If support fails we should expect 100.50 to be tested.
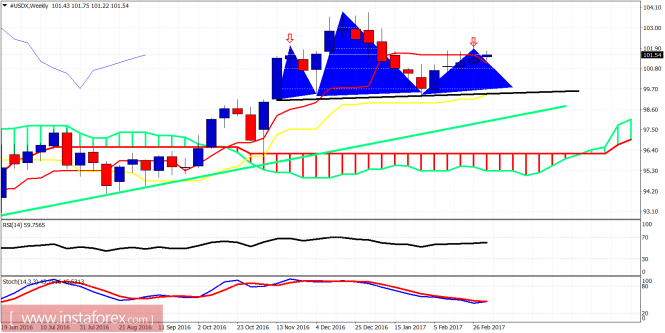 Black line - neckline support
Green line - long-term support
Blue area - Head and Shoulder pattern
The Dollar index weekly chart remains indecisive. The price is trading at the same levels as the left hand shoulder just below 102. 100.70 level is crucial support on a weekly basis. If it is broken we should expect the neckline to be tested. A break above 102.30 will increase the chances of making new highs towards 105.
The material has been provided by InstaForex Company - www.instaforex.com