
Overview:
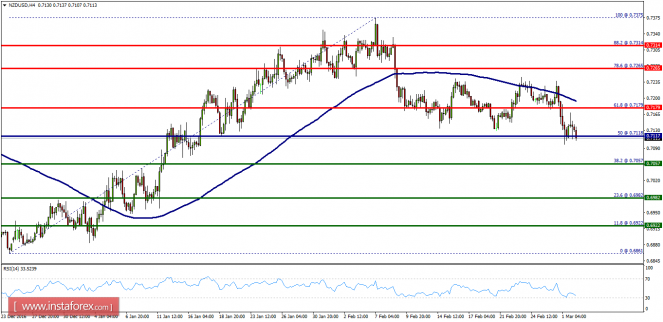
- The NZD/USD pair broke support which turned to strong resistance at the level of 0.7179.
- The level of 0.7179 coincides with 61.8% of Fibonacci, which is expected to act as the major resistance today.
- Because the trend is below the 61.8% Fibonacci level, the market is still in a downtrend.
- From this point, the NZD/USD pair is continuing in a bullish trend from the new support of 0.7118.
- Currently, the price is in a bearish channel. According to the previous events, we expect the NZD/USD pair to move between 0.7057 and 0.7179.
- On the H4 chart, resistance is seen at the levels of 0.7179 and 0.7265.
- Besides, it should be noticed that, the level of 0.7118 represents the daily pivot point.
- Therefore, strong resistance will be formed at the level of 0.7179 providing a clear signal to sell below the spot of 0.7179 and 0.7118 with the targets seen at 0.7057.
- If the trend breaks the support at 0.7057 (first support) the pair will move downwards continuing the development of the bearish trend to the level 0.6982 in order to test the daily support 2. What is more, it should be noted that major support is seen at the price of 0.6982.
- On the other hand, stop loss is to be placed above the level of 0.7265.