
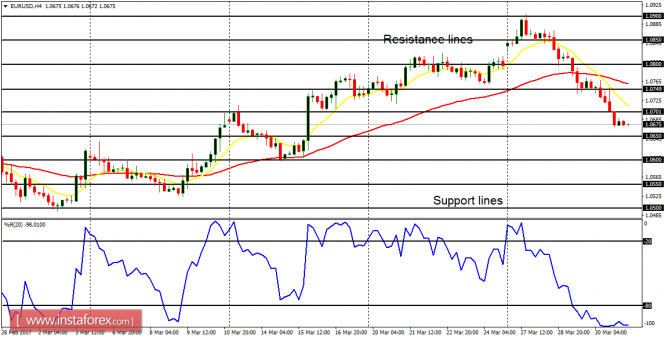
EUR/USD: There is already a bearish view on the EUR/USD pair, owing to the weakness that started in the market this week, which was long expected. The price tested the resistance line at 1.0900 and then declined by 220 pips. Further decline is expected as the price would go towards the support lines at 1.0650 and 1.0600.
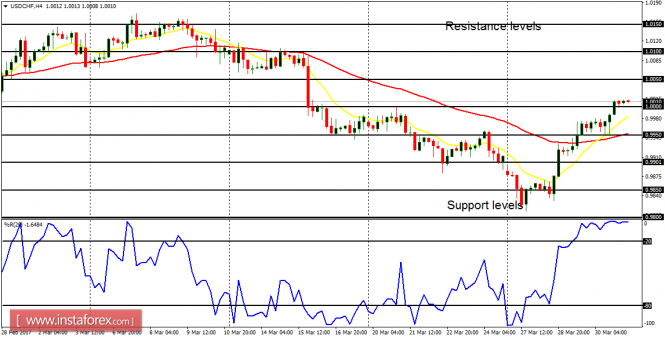
USD/CHF: After testing the support level at 0.9850, the USD/CHF pair went upwards by roughly 190 pips. The price is now above the psychological level at 1.0000 and it may go further upwards to test the resistance levels at 1.0050 and 1.0100. As long as the EUR/USD is weak, the USD/CHF pair would be strong. That is the simple logic.
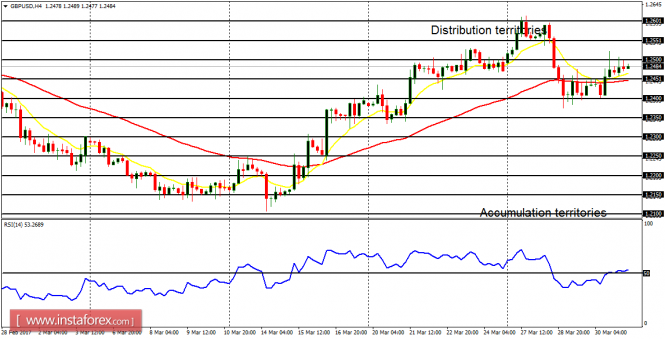
GBP/USD: The Cable still manages to be bullish in spite of the challenges it has experienced this month. The EMA 11 is above the EMA 56, while the RSI period 14 has moved above the level 50. It would be OK to seek long trades in this market, for that is the outlook for the next several trading days.
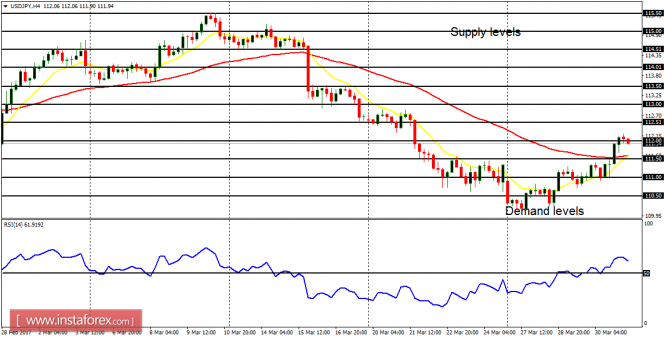
USD/JPY: What started as an upside consolidation on USD/JPY has finally become a formidable bullishness. The EMA 11 has almost crossed the EMA 56 to the upside and the RSI period 14 is almost above the level 50. A movement above the supply level at 112.50 would result in a Bullish Confirmation Pattern in the 4-hour chart.
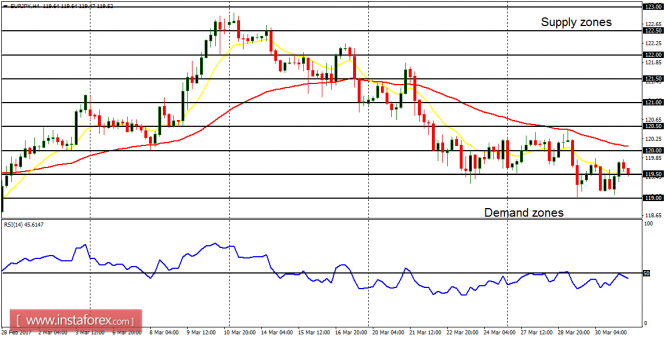
EUR/JPY: The cross has only moved sideways this week – in the context of a downtrend. There is a Bearish Confirmation Pattern in the chart, and further bearish movement is a possibility, for price may test the demand zones at 119.00 and 118.50. However, there remains a probability in the next several trading days.
from www.instaforex.com https://www.instaforex.com/forex_analysis/89998/?x=BPDZ
via IFTTT