General overview for 06/02/2017:
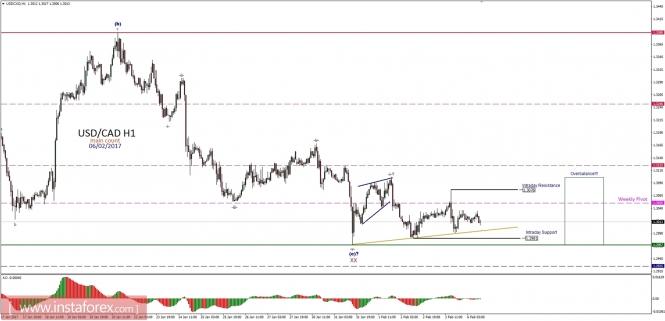
The bottom at the level of 1.2967 is the most important level for the whole bullish, impulsive scenario now. Any violation of this level would indicate that the old top at the level of 1.3598 is the big cycle wave B top. Now the market is developing impulsive wave structure to the downside, with a long-term target projection at the parity level. Nevertheless, to confirm the intraday bullish scenario, the price must break out above the intraday resistance at the level of 1.3076 and then head higher towards the weekly pivot resistance at the level of 1.3125 to create the overbalance. Please notice that the growing bullish divergence between the price and the momentum oscillator supports the view.
Support/Resistance:
1.2925 - WS1
1.2967 - Technical Support
1.2981 - Intraday Support
1.3050 - Weekly Pivot
1.3076 - Intraday Resistance
1.3125 - WR1
1.3246 - WR2
Trading recommendations:
Day traders should consider opening buy order from current levels with SL below the level of 1.2967 and TP at the level of 1.3125 (with a possible extension higher).