
Overview:
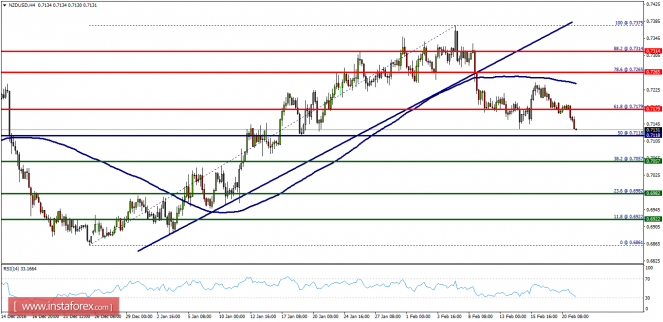
- The trend of the NZD/USD pair movement was controversial as it took place in a narrow sideways channel. Amid the previous events, the price is still trading between the levels of 0.7180 and 0.7057. Also, the daily resistance and support are seen at the levels of 0.7179 and 0.7057 respectively. Therefore, it is recommended to be cautious while placing orders in this area. So, we need to wait until the sideways channel is completed. This week, the market moved from its bottom at 0.7118 and continued rising towards the top of 0.7057. Today, on the one-hour chart, the current rise will remain within a framework of correction. However, if the pair fails to pass through the level of 0.7179, the market will indicate a bearish opportunity below the strong resistance level of 0.7179 (the level of 0.7179 coincides with the ratio of 61.8% Fibonacci). Since there is nothing new in this market, it is not bullish yet. Sell deals are recommended below the level of 0.7179 - 0.7118 with the first target at 0.7057. If the trend breaks the support level of 0.7057, the pair is likely to move downwards continuing the development of a bearish trend to the level 0.6982 in order to test the daily support 2.