
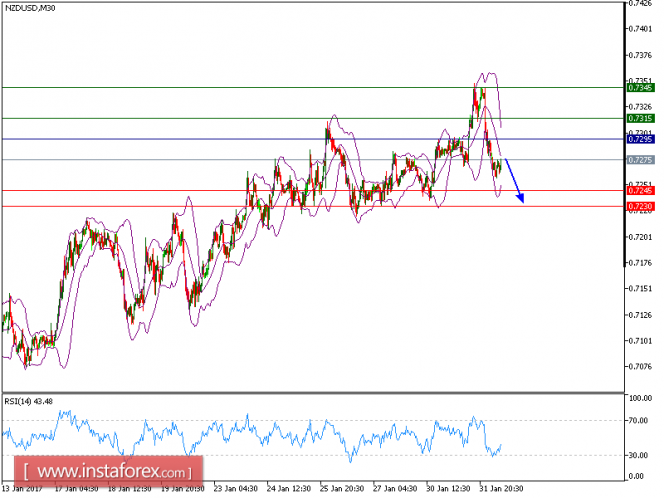
NZD/USD Intraday: further downside. The pair broke below its previous support at 0.7310, which becomes a resistance now. Additionally, the prices also broke below its 20-period and 50-period moving averages as well as the lower boundary of the Bollinger Band, which could signal the continuation of bearish acceleration. The relative strength index is bearish below its neutrality level at 50 and is heading downwards. As long as 0.7295 is resistance, look for a further drop to 0.7245 and even 0.7230 in extension.
The pair is trading below its pivot point. It is likely to trade in a lower range as long as it remains below the pivot point. Short positions are recommended with the first target at 0.7245. A break below this target will move the pair further downwards to 0.7230. The pivot point stands at 0.7295. If the price moves in the opposite direction and bounces back from the support level, it will move above its pivot point. It is likely to move further to the upside. According to that scenario, long positions are recommended with the first target at 0.7315 and the second one at 0.7345.
Resistance levels: 0.7315, 0.7345, 0.7375
Support levels: 0.7245, 0.7230, 0.7200
The material has been provided by InstaForex Company - www.instaforex.com