
The price of gold is in a bullish short-term trend. The price has reversed from $1,216 and is trying to break highs recorded this year of $1,244.50. We might see a pullback but overall technical picture is bullish and our target of $1,280-$1,320 remains valid.
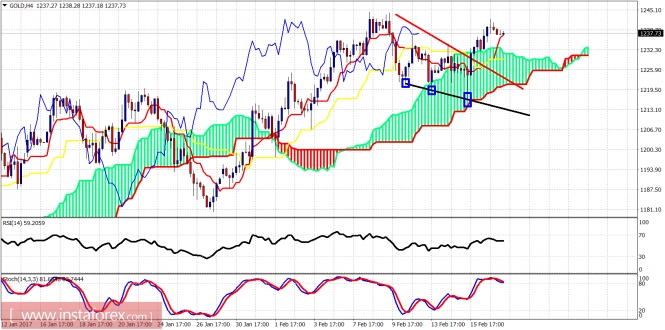
Black line - support
Gold is trading above the 4-hour cloud support. Trend is bullish. Short-term support is at $1,237 and the next is at $1,232 where the upper cloud boundary is found. I do not expect the price to break this week's low. On the other hand, I expect Gold to continue higher towards $1,280 at least.
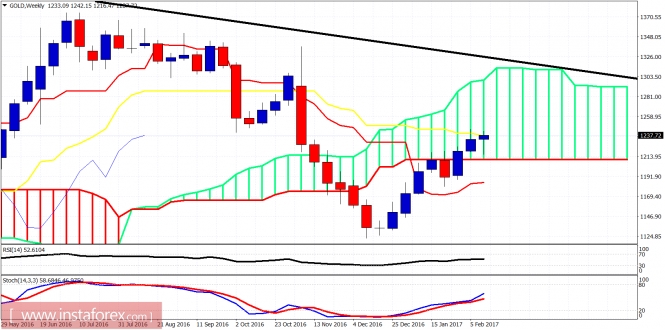
The weekly kijun-sen (yellow line indicator) is at $1,237.50 and as long as we trade above it and close the week above it, my target of $1,280 could be achieved until the end of the month. I expect Gold price to move towards the upper cloud boundary and test the long-term resistance trend line.
The material has been provided by InstaForex Company - www.instaforex.com