
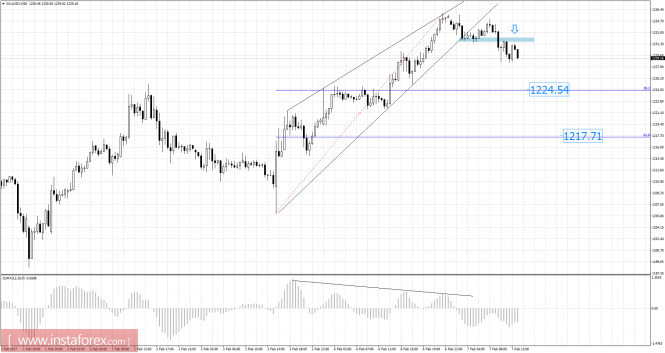
Recently, gold has been trading upwards. As I expected, the price tested the level of $1,235.70. According to the 30M time frame, I found a hidden unconfirmed bearish divergence in the background and broken upward trendline, which is a sign of potential weakness. My advice is to watch for potential selling opportunities. The price also broke previous support at the level of $1,231.40. I have placed Fibonacci retracement to find potential downward targets. I got Fibonacci retracement 38.2% at the price of $1,224.50 and Fibonacci retracement 61.8% at the price of $1,217.70.
Fibonacci pivot points :
Resistance levels :
R1: 1,234.45
R2: 1,238.40
R3: 1,244.85
Support levels:
S1: 1,221.50
S2: 1,217.50
S3: 1,211.00
Trading recommendations for today: watch for potential selling opportunities.
The material has been provided by InstaForex Company - www.instaforex.com