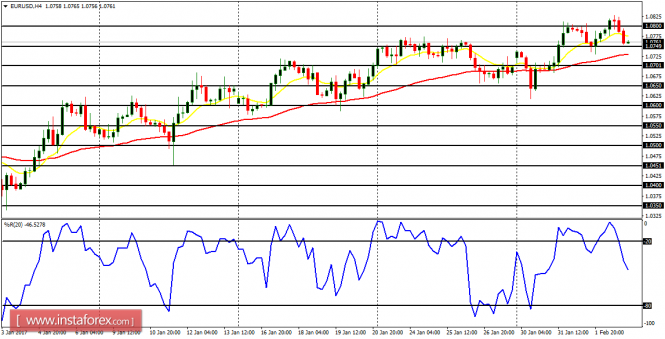
EUR/USD: The EUR/USD went upwards this week, going briefly above the resistance line at 1.0800 and then getting corrected lower. The bearish correction is shallow and should be fleeting, for the bullish movement would resume again, and price would move above the resistance line at 1.0800.
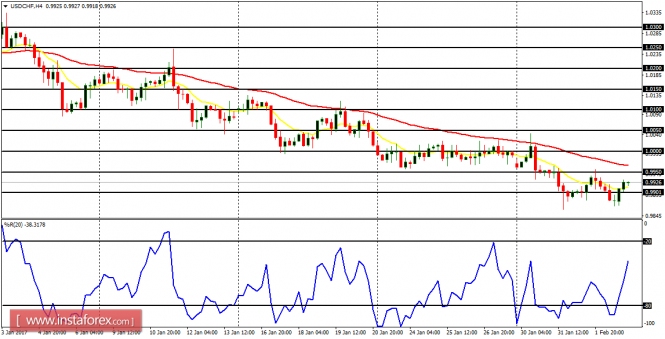
USD/CHF: This is a bear market and price has been trudging downwards in the last several trading days. The EMA 11 is below the EMA 56 and the RSI period 14 is below the level 50. This points to a real Bearish Confirmation Pattern in the chart, and the market is expected to go further and further downwards from here.
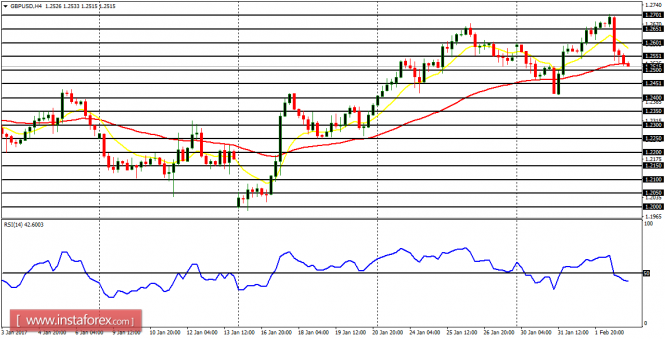
GBP/USD: The Cable underwent some pullback yesterday, and that was vivid enough to pose a threat to the already precarious bullish bias. A movement below the accumulation territory at 1.2300 would render the bullish bias completely invalid; while a northward movement from here would reinforce the bullish bias.
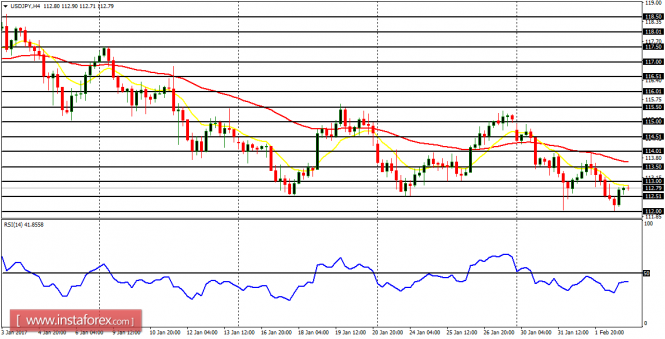
USD/JPY: The USD/JPY has already generated a bearish signal. There is a Bearish Confirmation Pattern in the chart, and price has gone below the supply level at 113.00, going toward the demand levels at 112.50. 112.00, and 111.50. These are the targets for the next several trading days.
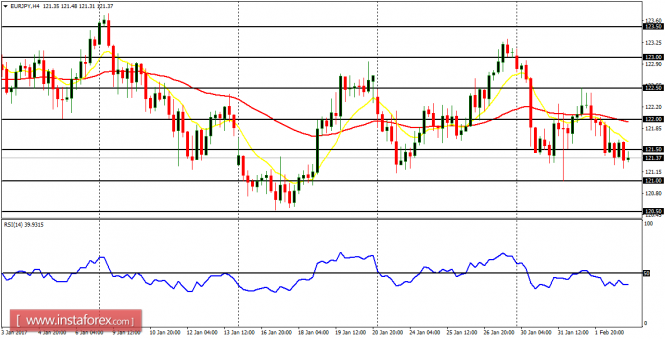
EUR/JPY: The EUR/JPY has already generated a bearish signal. There is a Bearish Confirmation Pattern in the chart, and price has gone below the supply zone at 121.50, going toward the demand zones at 121.00. 120.00, and 119.50. These are the targets for the next several trading days.