EUR/USD: The EUR/USD has gone down in the short-term, generating a short-term bearish signal. Price has gone down by more than 100 pips this week, now below the resistance line at 1.0700. The next target for bears is support line at 1.0650, which might even be breached to the downside.

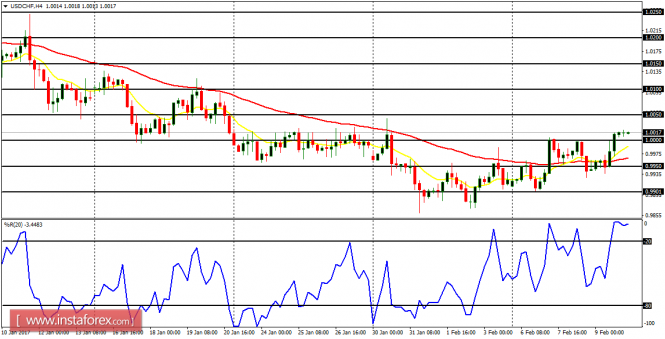
USD/CHF: The USD/CHF has generated a valid bullish signal. The market moved sideways last week, and consolidated to the upside this week. Price has been able to go above the important support level at 1.0000 and it would not be easy for it to go below that level again. Further bullish movement is expected within the next several trading days.
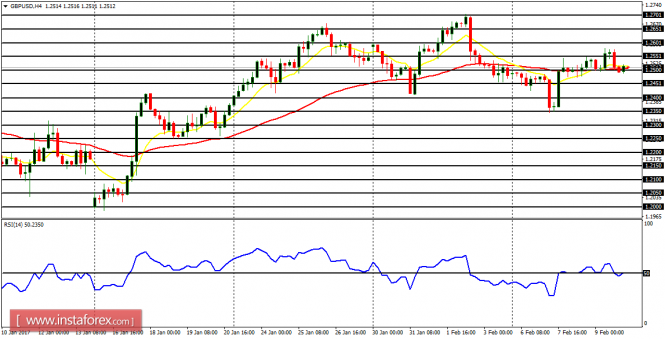
GBP/USD: The GBP/USD is still consolidating right now, but a significant rise in momentum is expected soon. Price might go above the distribution territory at 1.2650, generating a bullish signal; or go below the accumulation territory at 1.2350, generating a bearish signal in the market.
USD/JPY: This pair moved sideways from Monday till Wednesday and then started to trend upwards on Thursday. That upwards movement is strong enough to generate a bullish signal, and as soon the EMA 11 crosses the EMA 56 to the upside, and the RSI period 14 crosses the level 50 to the upside, a bullish bias would be confirmed.

EUR/JPY: The EUR/JPY moved downwards from Monday till Wednesday, reaching the demand zone at 119.50. Further downward movement has been rejected from that demand zone and price has gone upwards almost 200 pips from there. Another movement of 200 pips to the upside would result in a Bullish Confirmation Pattern in the chart.