
The pair had a very volatile day during Tuesday, as it's looking to consolidate above the 200 SMA zone at H1 chart. However, it can face soon the resistance level of 1.2480, where a breakout should open the doors to test the 1.2561 area. Overall structure remains bearish and eventually, GBP/USD could resume such trend to test the 1.2414 level.
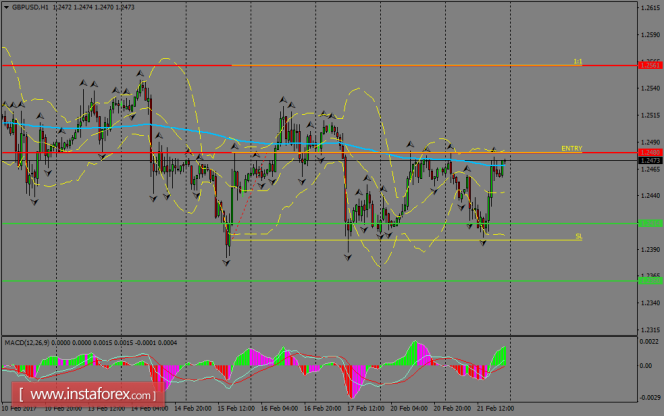
H1 chart's resistance levels: 1.2480 / 1.2561
H1 chart's support levels: 1.2414 / 1.2360
Trading recommendations for today: Based on the H1 chart, buy (long) orders only if the GBP/USD pair breaks a bullish candlestick; the resistance level is at 1.2480, take profit is at 1.2561 and stop loss is at 1.2398.
The material has been provided by InstaForex Company - www.instaforex.com