
The pair is recovering above the 200 SMA once again, as the Sterling got fresh momentum during yesterday's American session, amid a little sell-off seen in the USD. Currently, the Cable is targeting the 1.2561 zone, where a breakout should help to accelerate the upside toward 1.2645, while a pullback can send GBP/USD to test the support level of 1.2475.
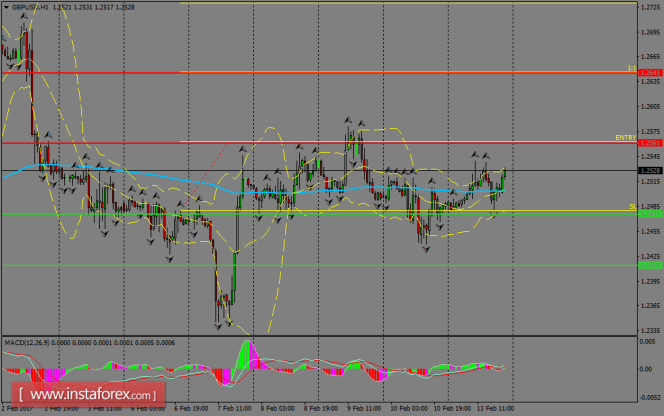
H1 chart's resistance levels: 1.2561 / 1.2645
H1 chart's support levels: 1.2475 / 1.2414
Trading recommendations for today: Based on the H1 chart, buy (long) orders only if the GBP/USD pair breaks a bullish candlestick; the resistance level is at 1.2561, take profit is at 1.2645 and stop loss is at 1.2480.
The material has been provided by InstaForex Company - www.instaforex.com