
The Dollar index despite the strong start yesterday and the break above 100.80, did not continue the rally but instead was pressured and pulled back towards 100.30. Price is making higher highs and higher lows in the short term but there is still no confirmed trend change.
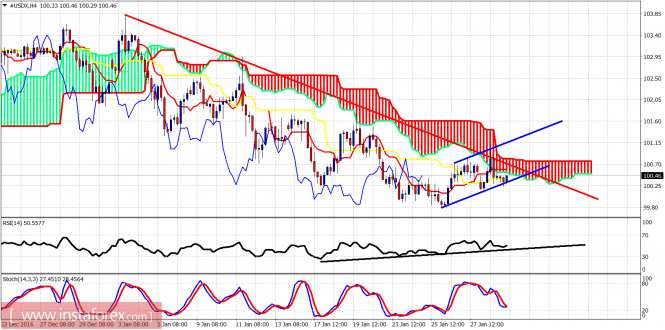
Blue lines - bullish channel
The Dollar index is trying to break out and above the resistance area of 101 where we find both the 4 hour Ichimoku cloud and the downward sloping red trend line. Price is making higher highs and higher lows but is still below the cloud. A break above 101 will be a bullish signal. Short-term support is at 100.10.
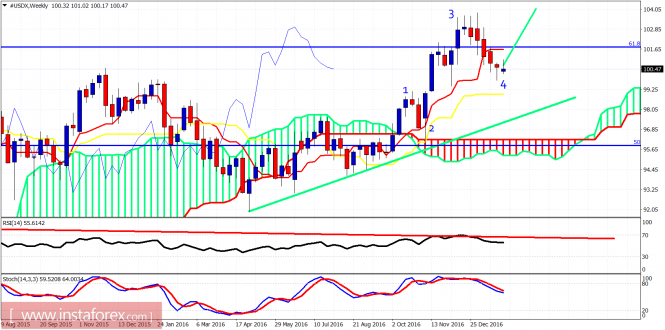
Green line - long-term support trend line
Price is trading between the tenkan- and kijun-sen (red and yellow line indicators). I expect the tenkan-sen to be tested. This is important resistance. A break above it will increase the chances we have completed wave 4 correction at 99.79.
The material has been provided by InstaForex Company - www.instaforex.com