
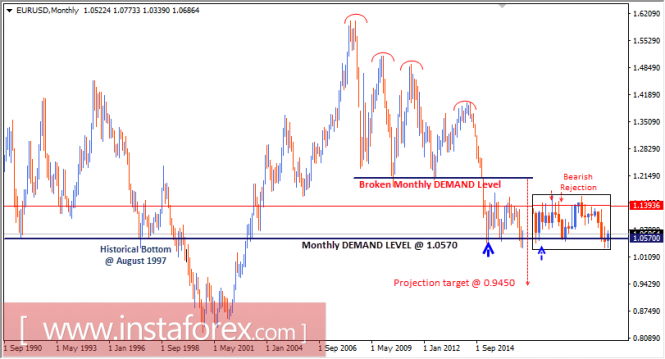
In January 2015, the EUR/USD pair moved below the major demand levels near 1.2100 where historical bottoms were previously set in July 2012 and June 2010.
Hence, a long-term bearish target was projected toward 0.9450.
In March 2015, EUR/USD bears challenged the monthly demand level around 1.0570, which had been previously reached in August 1997.
Later in April 2015, a strong bullish recovery was observed around the mentioned demand level.
However, next monthly candlesticks (September, October, and November) reflected a strong bearish rejection around the area of 1.1400-1.1500.
In the longer term, the level of 0.9450 remains a projected target if the current monthly candlestick achieves bearish closure below the depicted monthly demand level of 1.0570.
The long-term outlook for the EUR/USD pair remains bearish as the monthly chart illustrates. Bearish persistence below 1.0575 is needed to pursue this bearish scenario.
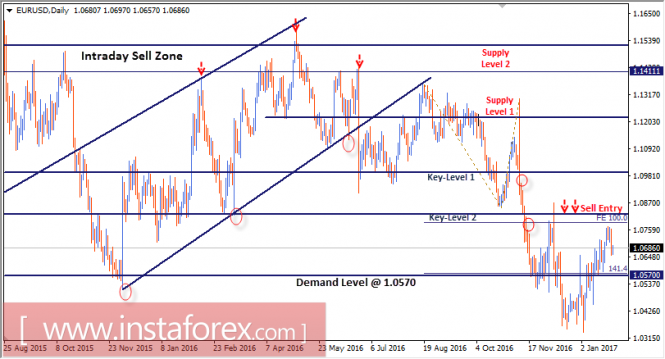
In September 2016, temporary bullish breakout above 1.1250 was expressed again, but evident bearish pressure was applied on the EUR/USD pair on September 16.
Closure below 1.1250 (supply level 1) maintained enough bearish pressure and enhanced the downside momentum toward the price level of 1.1000 (key level 1).
Bearish persistence below 1.0825 allowed further fall to occur at 1.0570 (demand level) where bullish rejection and a valid BUY entry were expressed on November 24.
Shortly after, the Fibonacci Expansion 100% (1.0825) constituted a recent supply level which offered a valid SELL entry on December 8.
Bearish persistence below the depicted demand level (1.0570) was expected to allow further decline toward 1.0220. However, significant bullish recovery was expressed around the price level of 1.0340 on January 3.
Bullish persistence above 1.0600 allows further bullish advance toward 1.0825-1.0850 (Fibonacci Expansion 100%) where bearish rejection should be anticipated.
Bullish breakout above 1.0570-1.0600 was executed on January 12. Hence, the price level of 1.0600 now constitutes a recent demand level to be watched for bullish rejection if any bearish pullback occurs.
The material has been provided by InstaForex Company - www.instaforex.com