
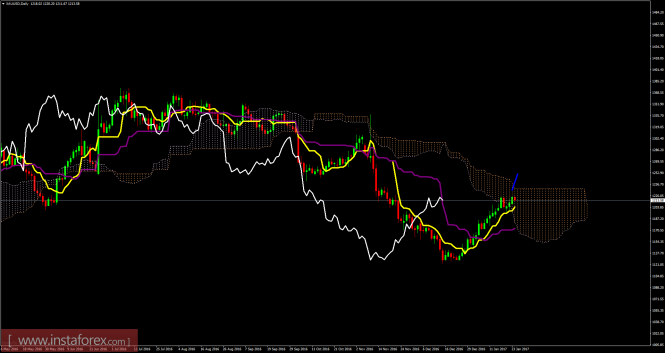
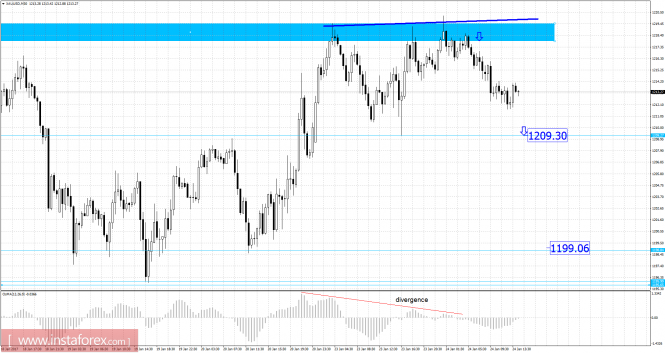
Recently, gold has been trading sideways at the price of $1,213.00. In the Daily time frame and using the Ichimoku cloud, I found that price is in the Ichimoku Cloud (equilibrium). The trend according to the daily time frame is neutral to bearish. According to the 30M time frame, I found potential double top formation and bearish divergence on Moving Average Oscilator, which is a sign of weakness. Anyway, to confirm this view price should break the level of $1,209.30. If the price breaks the level of $1,209.30, Gold may visit the level of $1,199.00 - $1,196.00.
Resistance levels:
R1: 1,215.75
R2: 1,216.50
R3: 1,219.35
Support levels:
S1: 1,212.15
S2: 1,209.30
S3: 1,208.50
Trading recommendations for today: Watch for potential selling opportunities.
The material has been provided by InstaForex Company - www.instaforex.com