
During the first trading day of 2017, GBP/USD managed to consolidate below the 200 SMA on H1 chart, as the resistance zone of 1.2384 continues to cap gains in the pair. Moreover, that moving average is providing a very solid dynamic resistance. If we see a breakout below the 1.2271 level, then we can expect a decline to take place towards the 1.2222 level.
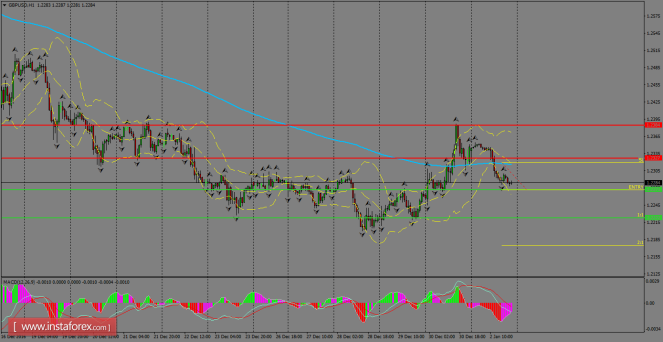
H1 chart's resistance levels: 1.2327 / 1.2384
H1 chart's support levels: 1.2271 / 1.2222
Trading recommendations for today: Based on the H1 chart, sell (short) orders only if the GBP/USD pair breaks a bearish candlestick; the support level is at 1.2271, take profit is at 1.2222 and stop loss is at 1.2319.
The material has been provided by InstaForex Company - www.instaforex.com