
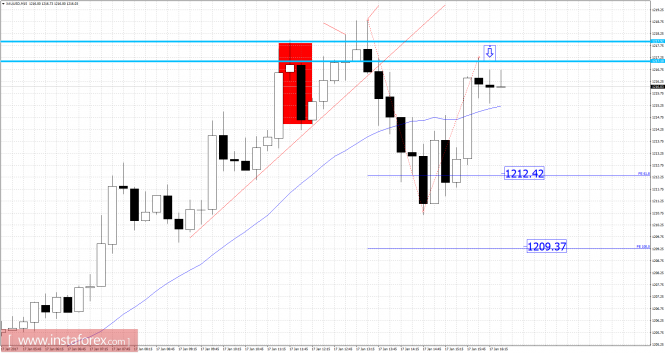
Recently, gold has been trading sideways at the price of $1,218.80, heading upwards. On the 15M time frame, I found a bearish engulfing pattern and price action resistance. There is also a broken upward trendline, which is a sign that buyers lost power. Intraday trend is still upward but I see potential downward corection. Downward targets are set at the levels of $1,212.40 and $1,209.40.
Resistance levels:
R1: 1,207.00
R2: 1,209.00
R3: 1,212.20
Support levels:
S1: 1,200.95
S2: 1,198.00
S3: 1,195.30
Trading recommendations for today: broken upward trendline and bearish enguling bars can be seen on the 15M time frame. Watch for potential selling opportunties.
The material has been provided by InstaForex Company - www.instaforex.com