
Trend analysis (Fig. 1).
Today, from the level of 1.2143 (closing of yesterday's daily candlestick), the market will attempt to continue moving upward with the target of 1.2261 - the target level (blue dotted line). If this level is tested, it is possible to work downward with a target of 1.2164 – a pullback level of 14.6% (red dotted line).
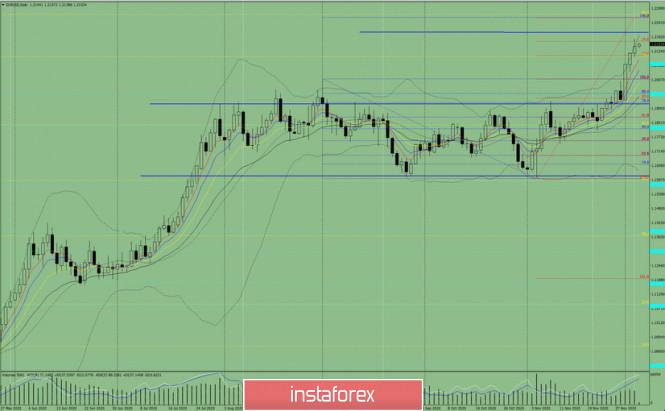
Figure 1 (Daily Chart).
Comprehensive analysis:
- Indicator analysis - up
- Fibonacci levels - up
- Volumes - up
- Candlestick analysis - down
- Trend analysis - up
- Bollinger bands - up
- Weekly chart - up
General conclusion:
Today, from the level of 1.2143 (closing of yesterday's daily candlestick), the price will try to continue moving upward with the target of 1.2261 – the target level of 161.8% (blue dotted line). If this level is tested, it is possible to work down with a target of 1.2164 – a pullback level of 14.6% (red dotted line).
Alternative scenario: when moving upward and testing 1.2261 - the target level of 161.8% (blue dotted line), it is possible to continue working upward with the final target of 1.2555 – the upper fractal (yellow dotted line), which is the daily candlestick from 16/02/2018.
The material has been provided by InstaForex Company - www.instaforex.com