
1-hour chart of EUR/USD
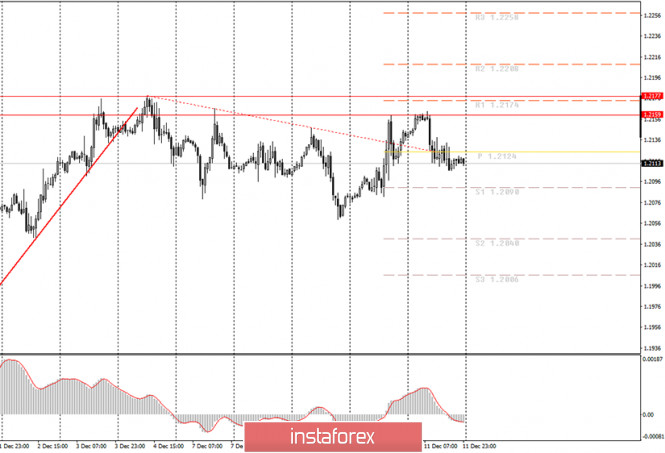
EUR/USD rebounded from 1.2159 for five days in a row. The area from 1.2159 to 1.2177 has formed a resistance zone from where the price has rebounded five times. At first glance, it looks like the pair is on the verge of a new downward trend. Does it mean that beginners will be able to sell the pair at a beneficial price? In practice, things are much more complicated. Let me remind you that a few weeks ago EUR/USD was trading sideways at near one-year highs for 4 months straight. That time, there was a good chance to see a new downward trend. However, the price actually escaped the trading range upwards and resumes an uptrend. So, something similar is likely to happen this time. Last trading week, EUR/USD managed to correct 100 pips downwards following a 400-pips climb. Thus, the odds are that the pair is about to resume the uptrend again. Nevertheless, let me warn you that it is not recommended to open new long positions now until the price surpasses the area of 1.2159 – 1.2177. Unfortunately, at present there is neither a trendline nor a trend channel to recognize at least a short-term trend. The bearish move is a possibility but there are no signals for a downward move.
On Friday December 11, the economic calendar lacked any economic data neither from the US nor from the EU. Anyway, I've already told you that lately traders take little notice of economic reports. A day earlier, market participants neglected policy decisions of the ECB. This policy meeting in December was rather significant because the regulator published important forecasts. Oddly enough, instead of the expected weakness and sell-offs, EUR again carried on with its advance. Hence, the situation is erratic and the market is difficult to trade for beginners.
This Monday, the EU is due to post a report on industrial production for October. Again, traders will hardly pay attention to this report. Thus, the economic calendar will be of little importance to influence trading decisions. In other words, traders should watch whether EUR/USD will overcome the area of 1.2159 – 1.2177. If this actually happens, the pair will resume its uptrend. If no, we can expect a further 50-60 pips downward move.
The following scenarios are possible on December 14:
1)Long positions are out of the question now because the area of 1.2159 – 1.2177 has not been surpassed yet in 5 attempts. So, under the current market conditions we should wait until an uptrend comes into being. Then, it will be possible to trade following the uptrend. Otherwise, we should wait until the price surpasses the above-said area. Afterwards, we could open long positions with targets at 1.2208 and 1.2258.
2)Trading the bearish bias looks more logic now. Nevertheless, the overall outlook remains bullish. Thus, I assume that the bearish move is possible only for a short term. Still, we could benefit from this move on Monday with a downward target at near 1.2060 which is the last local low as the MACD indicator is generating a sell signal. Alternatively, we could wait for a new sell signal after an upward correction is over.
What's on the chart:
Support and Resistance levels are the levels that are targets when opening buy or sell orders. Take Profit levels can be placed near them.
Red lines are channels or trend lines that display the current trend and show which direction it is preferable to trade now.
Up / down arrows show whether the pair should be traded up or down when reaching or overcoming particular obstacles.
MACD indicator (10,20,3) - a histogram and a signal line. When they are crossed, this signals a market entry. It is recommended for use in combination with trend lines (channels, trend lines).
Important speeches and reports in the economic calendar can greatly influence the movement of the currency pair. Therefore, during their release, it is recommended to trade as carefully as possible or exit the market in order to avoid a sharp price reversal against the previous movement.
Beginners in the forex market should remember that every trade cannot be profitable. The development of a clear strategy and money management are the key to success in trading over a long period of time.
The material has been provided by InstaForex Company - www.instaforex.com