
Trend Analysis (Fig. 1).
Today, the market will try to continue going up from the level of 1.1890 (closing of yesterday's daily candle) in order to reach the upper fractal of 1.1920 (daily candle from 09.11.2020). After reaching this level, there will be a work going up with the goal of 1.1978 at the upper border of the Bollinger line indicator (black dotted line).
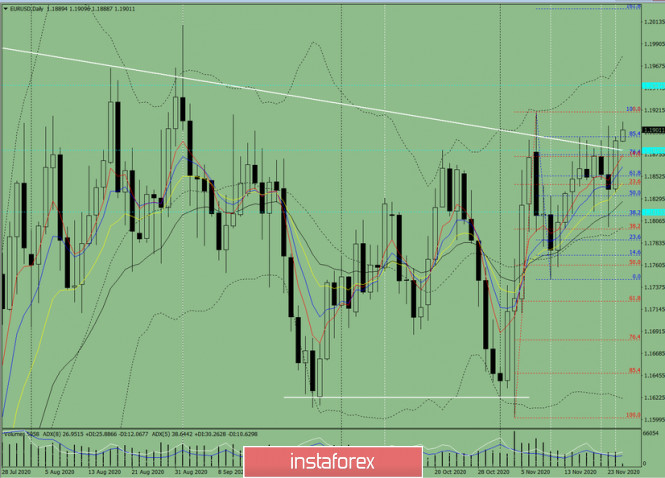
Figure 1 (daily chart).
Complex Analysis:
- Indicator Analysis - up
- Fibonacci levels - up
- Volumes - up
- Candle Analysis - up
- Trend Analysis - up
- Bollinger Bands - up
- Weekly Chart - up
General Conclusion:
Today, the price may continue to go up in order to reach the upper fractal of 1.1920 (daily candle from 09.11.2020). After reaching this level, there will be a work going up with the goal of 1.1978 at the upper border of the Bollinger line indicator (black dotted line).
Unlikely scenario: when moving up and reaching the upper fractal of 1.1920 (daily candle from 09.11.2020), the price may start moving down to the pullback level of 14.6% at 1.1873 (red dotted line).
The material has been provided by InstaForex Company - www.instaforex.com