
Trend analysis (Fig. 1).
Today the market may start moving down from the level of 1.1722 (which was the closing of Friday's daily candle) in order to reach the pullback level of 76.4% - 1.1665 (blue dotted line). If this line is tested, it is likely that the downward movement will continue with the target of 1.1648 which is the support line (black bold line).
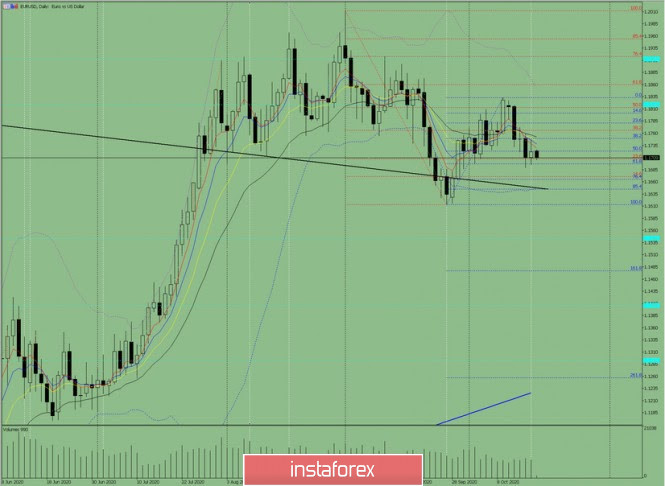
Figure 1 (daily chart).
Complex Analysis:
- Indicator Analysis – down
- Fibonacci Levels – down
- Volumes – down
- Candle Analysis – up
- Trend Analysis – down
- Bollinger Bands – down
- Weekly Chart - down
General conclusion:
Today, the price may make a downward movement with the goal of reaching the pullback level of 76.4% - 1.1665 (blue dotted line). If this line is tested, it is likely that the downward movement will continue with the target of 1.1648 - the support line (black bold line).
Unlikely scenario: from the level of 1.1722 (which was the closing of the Friday daily candle) work up with the goal of 1.1766 to the pullback level of 38.2% (red dotted line). After testing this level, it is possible to continue working up with the goal of 1.1812 50% pullback level (red dotted line).
The material has been provided by InstaForex Company - www.instaforex.com