
To open long positions on GBP/USD, you need:
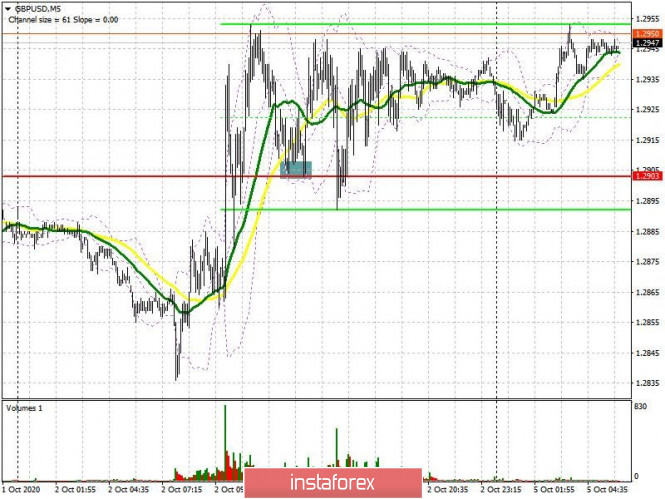
There was only one signal to buy the British pound last Friday, after the breakout and consolidation above the resistance level of 1.2903, which now acts as the middle of the sideways channel. If you look at the 5-minute chart, you can see the bulls pushing through this range and then there was a chance to test this area from top to bottom during the middle of the US session, which forms a good entry point into long positions.
But despite the pound's growth, the reports from the futures market indicated a deterioration in the situation of buyers. More people are willing to sell the British pound when it is higher. The Commitment of Traders (COT) reports for September 29 recorded a sharp rise in short positions and a reduction in long positions, which affected the net position and led to its larger negative value. This once again confirms the desire of traders to build up short positions with any growth in the level, counting on uncertainty over Brexit and the prospects for the recovery of the British economy. The pressure on the pound will gradually increase as the second wave of coronavirus spreads. Short non-commercial positions increased from 40,523 to 51,961 during the reporting week. Long non-commercial positions decreased from 43,487 to 39,216. As a result, the non-commercial net position became negative and reached -12,745, against 2,964 a week earlier, which indicates that control over the market is gradually returning to large sellers.
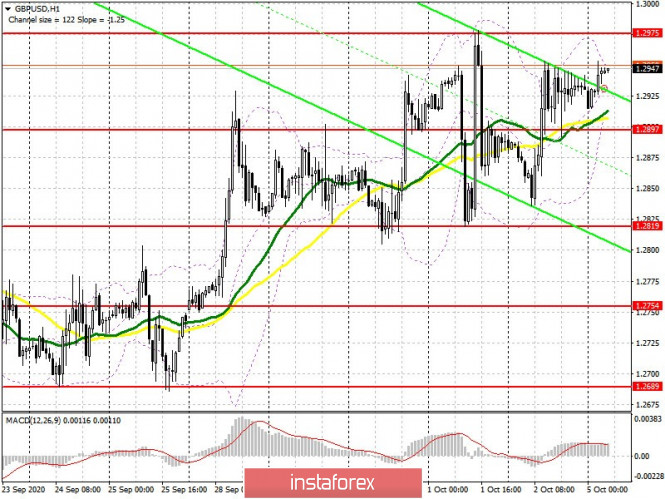
As for the current picture of the GBP/USD pair, traders need to get out of the horizontal channel, which is where it spent the entire period of the previous week. A breakout and being able to settle above 1.2975 will be a signal to open long positions, which may lead to removing a number of sellers' stop orders and also strengthen the pair's correction towards highs of 1.3029 and 1.3089, where I recommend taking profits. In case the pair falls, the emphasis will be placed on protecting the middle of the channel at 1.2897. Forming a false breakout there will be a signal to open long positions. If bulls are not active at this level, and it is quite possible that weak data on activity in the UK services sector might scare off new buyers, I recommend not to rush into buy positions, but to wait until the lower border of the horizontal channel at 1.2819 has been tested and buy the pound there on a rebound based on a correction of 30-40 points within the day.
To open short positions on GBP/USD, you need:
Sellers need to defend resistance at 1.2975 once again, where forming a false breakout will be a signal to open short positions in the hopes of returning to the bear market. Settling below the middle of the horizontal channel at 1.2897 will be an additional signal to sell the pound with the main goal of breaking through the major support of the previous week at 1.2819, which will then lead to a new, more serious wave of GBP/USD movement down to the 1.2754 and 1.2689 areas, where I recommend taking profits. In case the pound grows above the resistance of 1.2975, it is better not to rush to sell, since the market may shift to the side of buyers. Most likely, the bears will resort to protecting resistance at 1.3029, or it will be possible to sell GBP/USD immediately on a rebound from the 1.3089 high, counting on a correction of 30-40 points within the day.
Indicator signals:
Moving averages
Trading is carried out in the area of 30 and 50 moving averages, which indicates uncertainty regarding the direction in the short term.
Note: The period and prices of moving averages are considered by the author on the H1 hourly chart and differs from the general definition of the classic daily moving averages on the D1 daily chart.
Bollinger Bands
A breakout of the lower border of the indicator in the 1.2900 area will lead to a new wave of decline for the British pound. A breakout of the upper border in the 1.2945 area will lead to an upward correction of the pair.
Description of indicators
- Moving average (moving average, determines the current trend by smoothing out volatility and noise). Period 50. It is marked in yellow on the chart.
- Moving average (moving average, determines the current trend by smoothing out volatility and noise). Period 30. It is marked in green on the chart.
- MACD indicator (Moving Average Convergence/Divergence — convergence/divergence of moving averages) Quick EMA period 12. Slow EMA period to 26. SMA period 9
- Bollinger Bands (Bollinger Bands). Period 20
- Non-commercial speculative traders, such as individual traders, hedge funds, and large institutions that use the futures market for speculative purposes and meet certain requirements.
- Long non-commercial positions represent the total long open position of non-commercial traders.
- Short non-commercial positions represent the total short open position of non-commercial traders.
- Total non-commercial net position is the difference between short and long positions of non-commercial traders.