
The pair traded upward on Thursday upon the news and tested the historical resistance level of 1.1912 (blue dotted line), but after the news was worked out, the technical analysis took up and the price went down. The daily candle closed almost at the opening point. Today, the market may continue to move up. Economic calendar news for the dollar is expected at 12:30 UTC.
Trend analysis (Fig. 1).
The market may move upward from the level of 1.1816 (closing of yesterday's daily candle) with the target at the historical resistance level of 1.1912 (blue dotted line). In case of testing this level, the upward trend may continue with the next target at the level of 1.2012 located at the upper fractal (red dashed line).
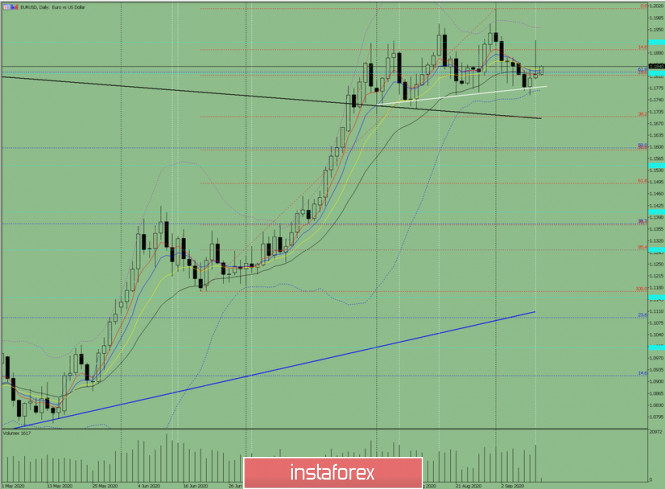
Figure: 1 (daily chart).
Comprehensive analysis:
- Indicator analysis - up;
- Fibonacci levels - up;
- Volumes - up;
- Candlestick analysis - up;
- Trend analysis - up;
- Bollinger lines - up;
- Weekly chart - up.
General conclusion:
Today, the price may move upward from the level of 1.1816 (closing of yesterday's daily candle) with the target at the historical resistance level of 1.1912 (blue dotted line). In case of testing this level, the upward trend may continue with the next target at the level of 1.2012 located at the upper fractal (red dotted line).
Another possible scenario is a test of the historical resistance level of 1.1912 (blue dashed line). After this, the price may move downward with the target at the level of 1.1813 - a 23.6% pullback (red dotted line).
The material has been provided by InstaForex Company - www.instaforex.com