
On Wednesday, the pair rose and tested the upper boundary of the Bollinger line indicator - 1.1243 (the purple dashed line). It was a strong downward signal on small volumes. On Thursday, strong calendar news is expected.
Trend analysis (Fig. 1).
On Thursday, the price is likely to start falling from the level of 1.1235 (closing of yesterday's daily candlestick) with the first target at 1.1169, the retracement level of 14.6% (the red dashed line). There is a possibility that the price may continue to go down from this level with the next target at 1.1112, the retracement level of 23.6% (the red dashed line). Strong calendar news which is set for release today can greatly affect the price movement.
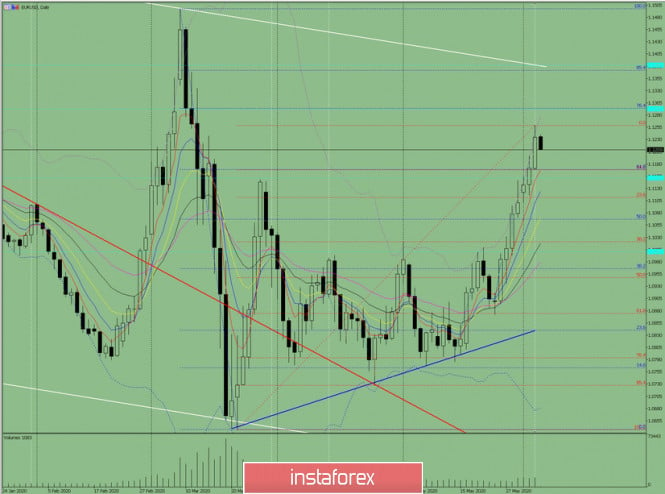
Fig. 1 (daily chart).
Comprehensive analysis:
- indicator analysis - down;
- Fibonacci retracement levels - down;
- volumes - down;
- candlestick analysis - down;
- trend analysis - up;
- Bollinger Lines - down;
- weekly chart - up.
General conclusion:
Today, the price is expected to start falling from the level of 1.1235 (closing of yesterday's daily candlestick) with the first target at 1.1169 - that is, the retracement level of 14.6% (the red dashed line). There is a possibility that the price may continue to go down from this level with the next target at 1.1112, the retracement level of 23.6% (the red dashed line).
Alternatively, after reaching 1.1169 (the red dashed line) - that is, the lower retracement level of 14.6%, the price may rise with the target at 1.1295 (the blue dashed line) - that is, the retracement level of 76.4%.
The material has been provided by InstaForex Company - www.instaforex.com