
On Wednesday, the pair moved down in the side channel, expecting Thursday's strong news. Today, the market is waiting for news on OPEC. According to the technique, the price may continue to move down. On Thursday, strong calendar news is expected at 11.30 Universal time (Euro), and 12.30 Universal time (dollar).
Trend analysis (Fig. 1).
On Thursday, the market from the pullback level of 23.6% - 1.0858 (red dashed line) can continue to move down, with the target of 1.0832 - the pullback level of 61.8% (blue dashed line). If this level is broken down, the downward movement will continue with the target of 1.0769 - the lower fractal (red dashed line).
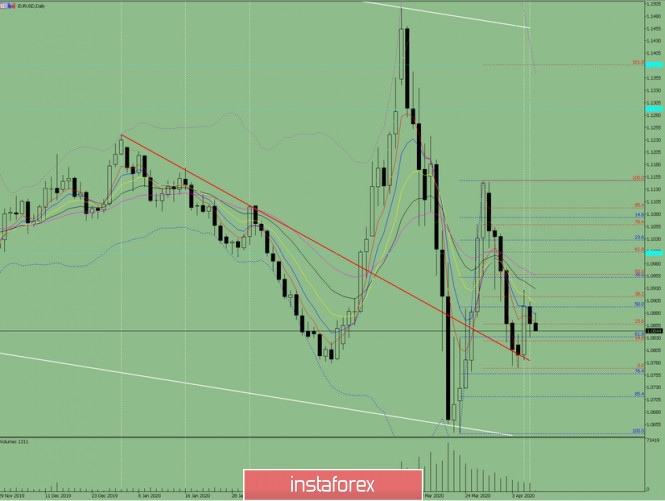
Fig. 1 (daily chart).
Comprehensive analysis:
- indicator analysis - down;
- Fibonacci levels - down;
- volumes - down;
- candlestick analysis - neutral;
- trend analysis - up;
- Bollinger lines - down;
- weekly schedule - down.
General conclusion:
Today, the price will try to continue to decline with the target at 1.0769 - the lower fractal (red
dashed line).
An unlikely scenario: the price can move up from a pullback level of 61.8% - 1.0832 (blue
dashed line) with a target of 1.0913, which is a pullback level of 38.2% (red dashed line).
The material has been provided by InstaForex Company - www.instaforex.com