
Trend analysis (Fig. 1).
Today, from a pullback level of 38.2% equivalent to 1.1454 (red dashed line) the price may begin to move downward with the target at the support line 1.1350 (white bold line). Upon reaching this level, an upward movement is possible with the target at the upper fractal 1.1497 (blue dashed line).
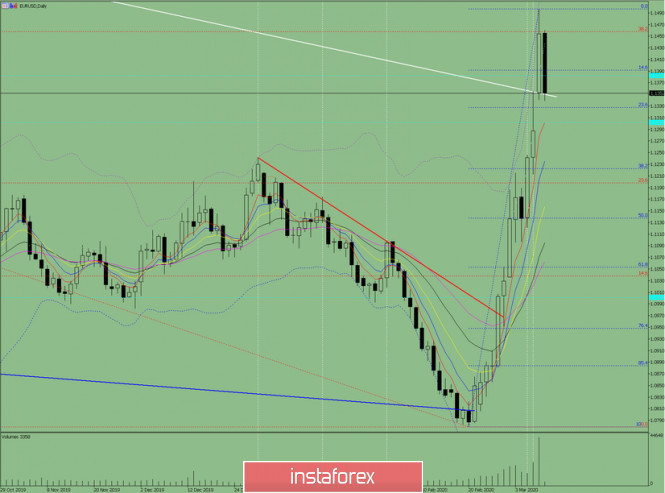
Fig. 1 (daily chart).
Comprehensive analysis:
- Indicator analysis - down;
- Fibonacci levels - down;
- Volumes - down;
- Candlestick analysis - down;
- Trend analysis - down;
- Bollinger Lines - down;
- Weekly schedule - up.
General conclusion:
Today, from the retracement level of 38.2% equivalent 1.1454 (red dotted line) the price may begin to move downward with the target at the support line 1.1350 (white bold line). Upon reaching this level, an upward movement is possible with the target at the upper fractal 1.1497 (blue dashed line).
An unlikely scenario: from the support line 1.1350 (white bold line), work down with the target 1.1223, a pullback level of 38.2% (blue dashed line).
The material has been provided by InstaForex Company - www.instaforex.com