
It's time to pay attention to the "health" of cross-instruments. Here's the comprehensive analysis of movement options of #USDX vs EUR/GBP vs GBP/JPY vs EUR/JPY (DAILY) on March 20, 2020.
Minor operational scale (daily time frame)
____________________
US dollar index
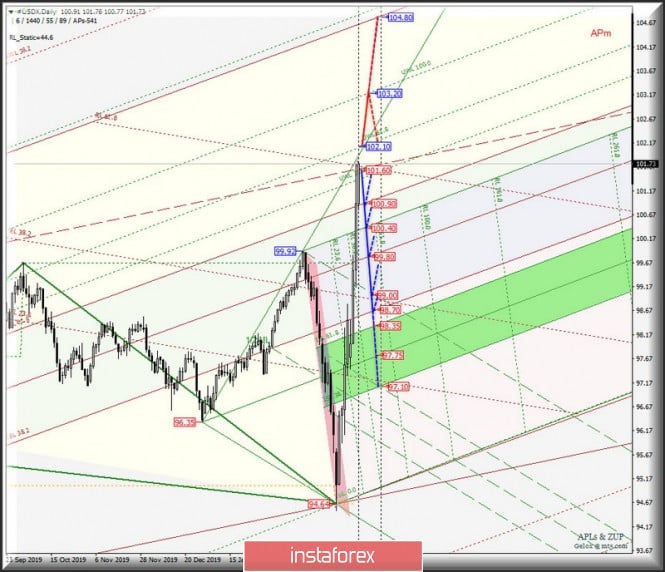
The movement of the #USDX index from March 20, 2020 will continue depending on the direction of the breakdown of the range :
- resistance level of 102.10 - control line UTL of the Minuette operational scale forks;
- support level of 101.60 - the ultimate Shiff Line of the Minor operational scale forks.
In case of breakdown of the final Schiff Line (support level of 101.60) of the Minor operational scale pitchfork, the development of the dollar index movement can be directed to the equilibrium zone (100.90 - 99.80 - 98.70) of the Minor operational scale forks.
On the other hand, in the event of a breakdown of the control line UTL (resistance level of 102.10) of the Minuette operational scale forks, the upward movement #USDX will be directed to the warning line UWL100.0 (103.20) of the Minuette operational scale forks with the prospect of reaching the final line FSL (106.80) of the Minor operational scale forks.
The markup of the #USDX movement options on March 20, 2020 is shown on the animated chart.
____________________
Euro vs Great Britain pound
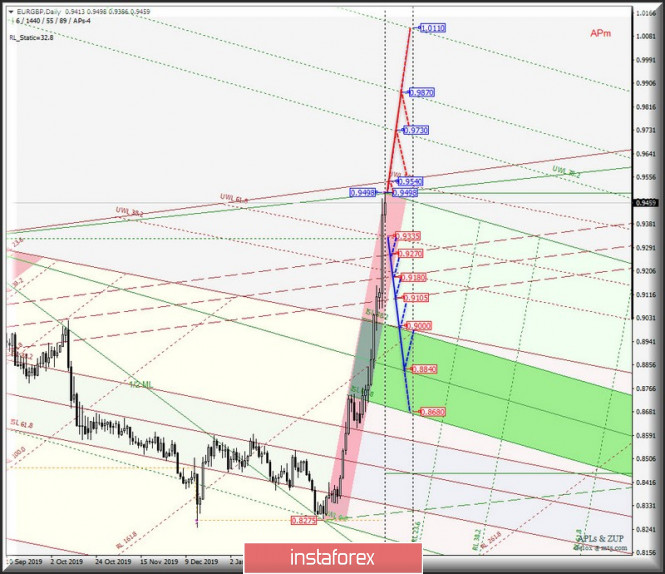
The movement of the cross-instrument EUR / GBP cross on March 20, 2020 will depend on the development and direction of the breakdown of the range :
- resistance level of 0.9498 - control line UTL of the Minuette operational scale forks;
- support level of 0.9335 - warning line UWL61.8 of the Minor operational scale forks.
The breakdown of the warning line UWL61.8 (support level of 0.9335) of the Minor operational scale forks will lead to the option for the development of the movement of this cross-instrument to the boundaries of the 1/2 Median Line channel (0.9270 - 0.9130 - 0.9105) of the Minor operational scale forks and the equilibrium zone (0.9000 - 0.8840 - 0.8680) of the Minuette operational scale forks.
Alternatively, in case of sequential breakdown of the resistance level of 0.9498 (control line UWL of the Minuette operational scale forks) and control line UWL (0.9540)of the Minor operational scale forks, then the upward movement EUR / GBP can be continued to the warning lines - UWL38.2 (0.9730) and UWL61.8 (0.9870) of the Minuette operational scale forks.
The details of the EUR / GBP movement options from March 20, 2020 are shown on the animated chart.
____________________
Great Britain pound vs Japanese yen
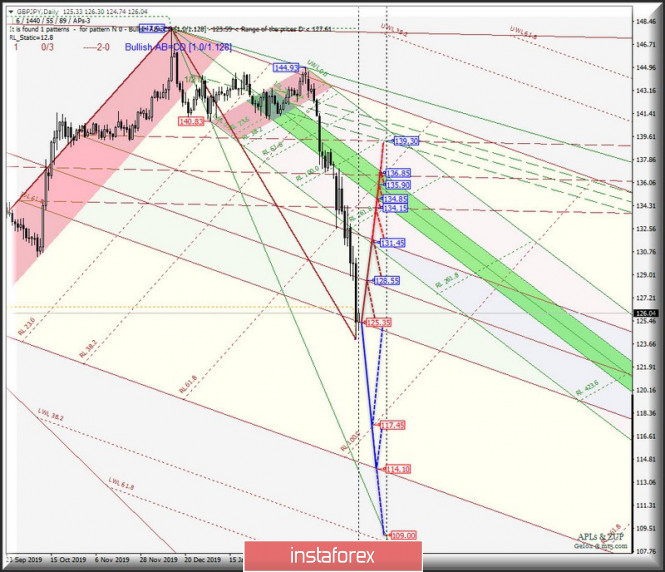
The development of the GBP / JPY cross-instrument movement from March 20, 2020 will depend on the development of the boundaries of the equilibrium zone (125.35 - 128.55 - 131.45) of the Minor operational scale forks. The markup for developing these levels is presented on the animated chart.
In case of breakdown of the upper boundary ISL38.2 (resistance level of 131.45) of the equilibrium zone of the Minor operational scale forks, the development of the GBP / JPY movement will continue to the boundaries of the 1/2 Median Line Minor channel (134.15 - 136.85 - 139.30).
On the other hand, the return of the cross-instrument below the support level of 125.35 (the lower boundary of the ISL38.2 equilibrium zone of the Minor operational scale forks) will make it possible to continue the development of the downward movement to the reaction line RL100.0 (117.45) and the final line FSL (114.10) of the Minor operational scale forks.
The details of the GBP / JPY movement on March 20, 2020 can be seen on the animated chart.
____________________
Euro vs Japanese yen
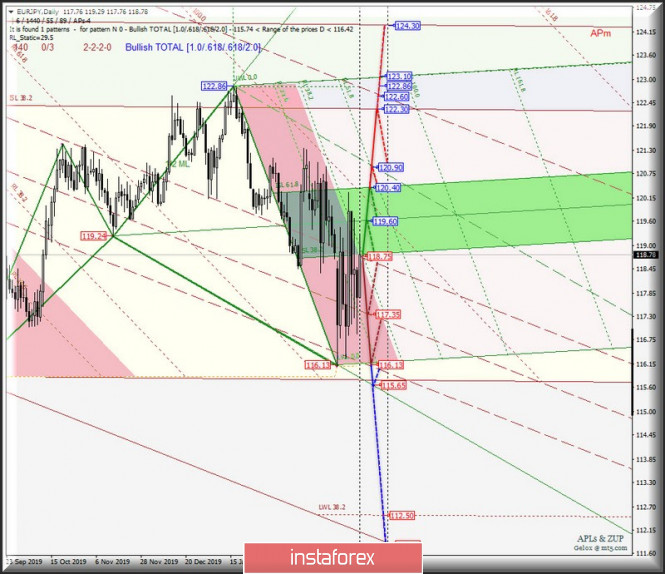
The further development of the movement of the EUR / JPY cross-instrument from March 20, 202 will be determined by developing the level of 118.75 at the intersection of the lower boundary of the ISL38.2 equilibrium zone of the Minuette operational scale forks and the upper boundary of the a Median Line channel of the Minor operational scale forks.
The movement of EUR / JPY above the level of 18.75 will develop in the equilibrium zone (118.75 - 119.60 - 120.40) of the Minuette operational scale forks with the prospect of reaching the final Schiff Line Minuette (120.90) and the lower boundary of ISL38.2 (122.30) equilibrium zone of the Minuette operational scale forks.
On the contrary, the movement of EUR / JPY below the level of 118.75 will continue to develop in the 1/2 Median Line channel (118.75 - 117.35 - 116.13) of the Minor operational scale forks with the prospect of reaching the LWL control line (115.65) of the Minuette operational scale forks.
We look at the details of the USD / JPY movement from March 20, 2020 on the animated chart.
____________________
The review was compiled without taking into account the news background. Thus, the opening trading sessions of major financial centers does not serve as a guide to action (placing orders "sell" or "buy").
The formula for calculating the dollar index :
USDX = 50.14348112 * USDEUR0.576 * USDJPY0.136 * USDGBP0.119 * USDCAD0.091 * USDSEK0.042 * USDCHF0.036.
where the power coefficients correspond to the weights of the currencies in the basket:
Euro - 57.6% ;
Yen - 13.6% ;
Pound Sterling - 11.9% ;
Canadian dollar - 9.1%;
Swedish krona - 4.2%;
Swiss franc - 3.6%.
The first coefficient in the formula leads the index to 100 at the starting date - March 1973, when the main currencies began to be freely quoted relative to each other.
The material has been provided by InstaForex Company - www.instaforex.com