
Trend analysis (Fig. 1).
Today, from the level of 1.2884 (closing of yesterday's afternoon candle), a downward movement is possible with the target of 1.2849, the lower fractal (red dashed line). If this level is reached, the continuation of work down is towards the target of 1.2700, the retracement level of 61.8% (yellow dashed line).
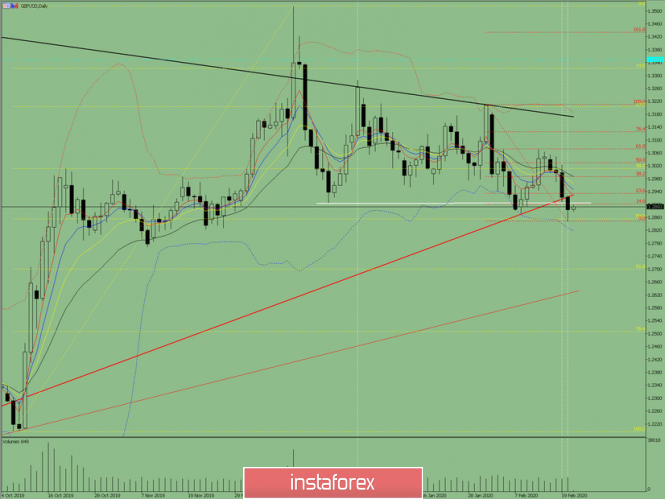
Fig. 1 (daily chart).
Comprehensive analysis:
- Indicator analysis - down;
- Fibonacci levels - down;
- Volumes - down;
- Candlestick analysis - up;
- Trend analysis - down;
- Bollinger lines - down;
- Weekly schedule - down.
General conclusion:
Today, the price may continue to move down.
An unlikely but quite possible scenario is from the level of 1.2884 (closing of yesterday's candle), work up with the target of 1.2947, the pullback level of 38.2% (red dashed line).
The material has been provided by InstaForex Company - www.instaforex.com