Crypto Industry News:
Ethereum developers have presented a way of communication between individual blockchains. This solution is called the interface standard for transaction transfers. Multichain Ethereum is becoming a fact, and this is how the whole process is explained by the developers of the second most popular cryptocurrency network in the world:
"The process of verifying the transaction sender's address by verifying the signed transaction in every Ethereum compatible wallet is the same. The enforcement of smart contracts by posting gas to relays using the signed meta-transactions in the standard Ethereum portfolio looks the same on the main chain and chains compatible with Ethereum. "
In this case, they use a centralized relay - Klaytn Service Provider, however, anyone can act as a message relay as long as it supports both chains. Interestingly, a test version of the Enterprise Ethereum Alliance private blockchain was also selected. Combining private and public blockchain would be a big step towards creating decentralized and objective side chains, which would help to solve scalability problems.
Technical Market Overview:
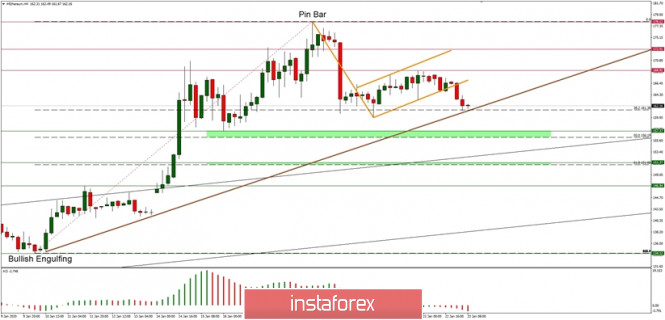
The ETH/USD has broken out form the local consolidation zone located between the level of $178.12 - $172.91 and managed to hit the 38% Fibonacci retracement at the level of $161.38 again ( the low was made at the level of $159.93). There is a visible Bearish Flag price pattern at the H4 chart (thick orange line), so if the bearish pressure intensifies again, then the next target for bears is seen at the level of $157.37 and $151.37. Please notice that this is a quite strong technical support zone due to the short-term ascending trendline presence around these levels.
Weekly Pivot Points:
WR3 - $219.38
WR2 - $198.31
WR1 - $181.78
Weekly Pivot - $161.46
WS1 - $144.93
WS2 - $123.85
WS3 - $107.13
Trading recommendations:
There is a possibility that the wave 2 corrective cycles are completed at the level of $115.05, so the market might be ready for another impulsive wave up of a higher degree and uptrend continuation. This strategy is valid as long as the level of $146.94 is not violated. Nevertheless, the larger timeframe trend is still down and all the shorter timeframe moves are still being treated as a counter-trend correction inside of the uptrend until the level of $196.61 is cleary broken.