
Trend analysis (Fig. 1).
On Friday, the price may continue to move up with the first target of 1.1128, the historical resistance level presented in a blue dashed line. If you reach this level, continue to work up.
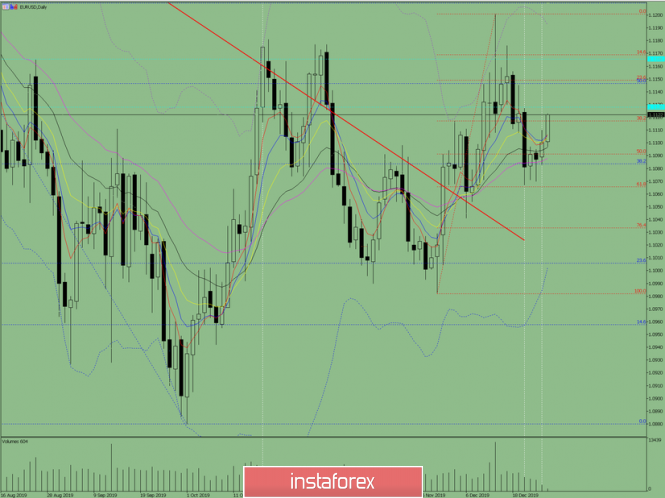
Fig. 1 (daily chart).
Comprehensive analysis:
- Indicator analysis - up;
- Fibonacci levels - up;
- Volumes - up;
- Candlestick analysis - up;
- Trend analysis - up;
- Bollinger Lines - up;
- Weekly schedule - up.
General conclusion:
An upward trend is possible today.
There is an unlikely, but quite possible scenario where from a pullback level of 38.2% which is equivalent to 1.1117 presented in a red dashed line, the price goes down to the lower target of 1.1067, the lower fractal presented in a red dashed line.
The material has been provided by InstaForex Company - www.instaforex.com