MG Network

something big isHappening!

In the mean time you can connect with us with via:

Copyright © Money Grows Network | Theme By Gooyaabi Templates

Money Grows Network

Archive

Powered by Blogger.

Welcome To Money Grows Network

Verified By

2006 - 2019 © www.moneygrows.net

Investments in financial products are subject to market risk. Some financial products, such as currency exchange, are highly speculative and any investment should only be done with risk capital. Prices rise and fall and past performance is no assurance of future performance. This website is an information site only.

Popular

Pages

Expert In

Name*


Message*

Ichimoku cloud indicator analysis of Gold

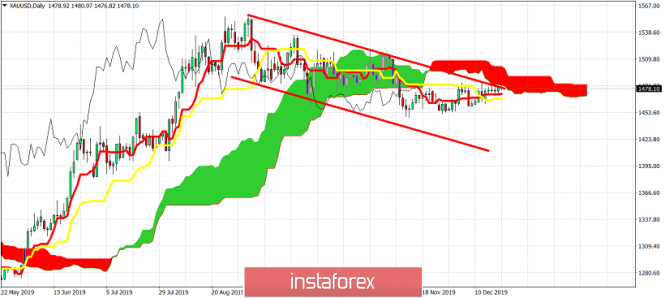
Gold price has made no real progress to the upside the past week. Gold price managed to climb back towards the major resistance of $1,490-$1,500 but in the end it got rejected. A bearish sign.

analytics5dfe5bed03ccf.png

Red line - resistance trend line

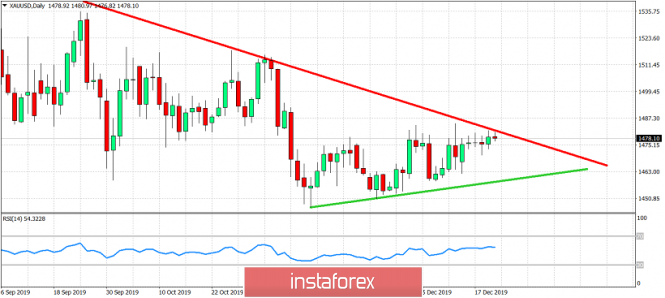
Green line - support trend line

Gold price is challenging the medium-term downward sloping red trend line resistance. Trend remains bearish as price is still below this trend line. Support is at $1,460 where we see the green upward sloping trend line. As long as price holds above this level, bulls still have hopes for a break above the $1,490-$1,500 resistance and a move towards $1,550-$1,600. If price breaks below support we expect $1,430-$1,400 to be seen. Near resistance we prefer to be sellers as the risk reward favors the bearish scenario.

analytics5dfe5c8bc33a1.png

In ichimoku cloud terms we confirm that price is below major resistance as price is still below the red Kumo (cloud) inside the bearish channel. Price is above the tenkan- and kijun-sen indicators which provide support at $1,467-72. A daily close below this area will be a bearish sign increasing the chances of breaking below $1,460.The material has been provided by InstaForex Company - www.instaforex.com