
Technical outlook:
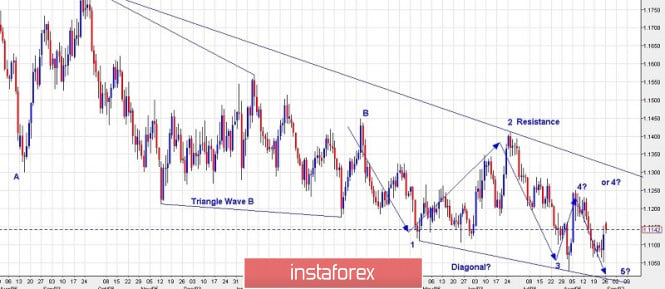
A daily chart potential wave counts are presented here, The EUR/USD pair seems to be carving Wave C of A-B-C drop from 1.2555 levels from 2018. Wave A was in 5 waves, Wave B could be a triangle as shown above and Wave C is a potential ending diagonal into its last Wave 5 being carved out. Please note that Wave 4 within the ending diagonal might have terminated at 1.1250 levels or it could push and terminate through 1.1260. A wave 5 is then expected to carve yet another low below 1.1020, going forward. If the above count holds true, prices should remain below 1.1412, which is also immediate price resistance as depicted above. Overall trading strategy would be to remain short with a protective stop above 1.1412 levels for now. On the flip side, if prices break above 1.1412, then the projected bearish count would turn invalid and also that Wave C already terminated at 1.1020 levels.
Trading plan:
Remain short for now, stop at 1.1412, target below 1.1020
Good luck!
The material has been provided by InstaForex Company - www.instaforex.com