EUR/USD
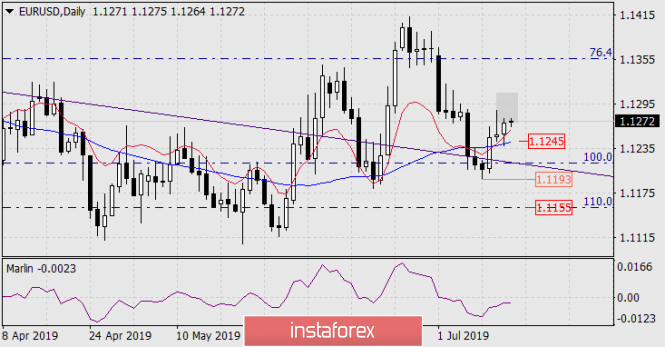
Last Friday, the euro repeated the story of Thursday - the euro tried to attack the savings range from July 2-4, but could not do it. On the daily scale chart, the price is above the balance line (red indicator) and above the MACD line (blue indicator) - this is a sign of growth, but the signal line of the leading Marlin oscillator is still in the zone of negative values and is currently turning down. Leaving prices below the MACD line (1.1245) would mean the completion of an upward correction and the euro's decline in the medium term.
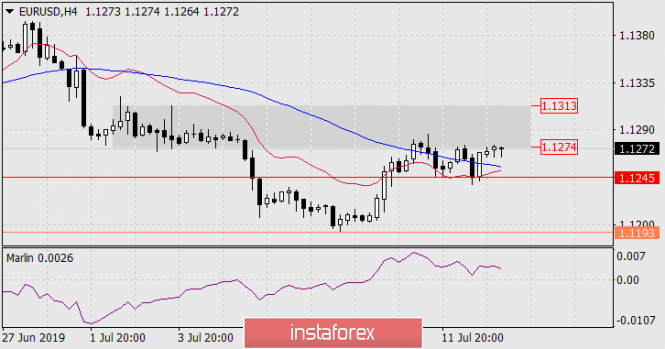
On the four-hour chart, the decline in the signal line of the oscillator is more pronounced. Here, the signal level of 1.1245 practically corresponds to the location of indicator lines. If the price goes below this level, the signal line of the Marlin oscillator will also be in the zone of negative numbers; it will create a signal to move to a nearest target of 1.1193 - the low of July 9th. Although in reality this level is not a target level, it is a signal level, the overcoming of which will become a condition for a further fall to a full-fledged target of 1.1155 - the Fibonacci level 110.0% on the daily chart and this is our main scenario.