
To open long positions on EURUSD you need:
The pressure on the euro persists amid weak eurozone reports. It is best to return to buying EUR/USD after consolidating above the resistance of 1.1181, which will lead to an upward correction to the level of 1.1205, where I recommend taking profits. In case the euro further declines after a weak report on inflation in the eurozone, it is best to consider long positions only from the support level of 1.1155, provided there is a false breakdown there, or to rebound from a support of 1.1138.
To open short positions on EURUSD you need:
The formation of a false breakdown in the resistance area of 1.1181 will be the first signal to open short positions in EUR/USD, which will keep the pair in a downward price channel and return sellers looking to test a new week low in the area of 1.1155 and 1.1138, where I recommend taking profits. If the euro rises in the first half of the day after a good report on inflation in the eurozone, it's best to open short positions to rebound from a high of 1.1205 and 1.1237.
Indicator signals:
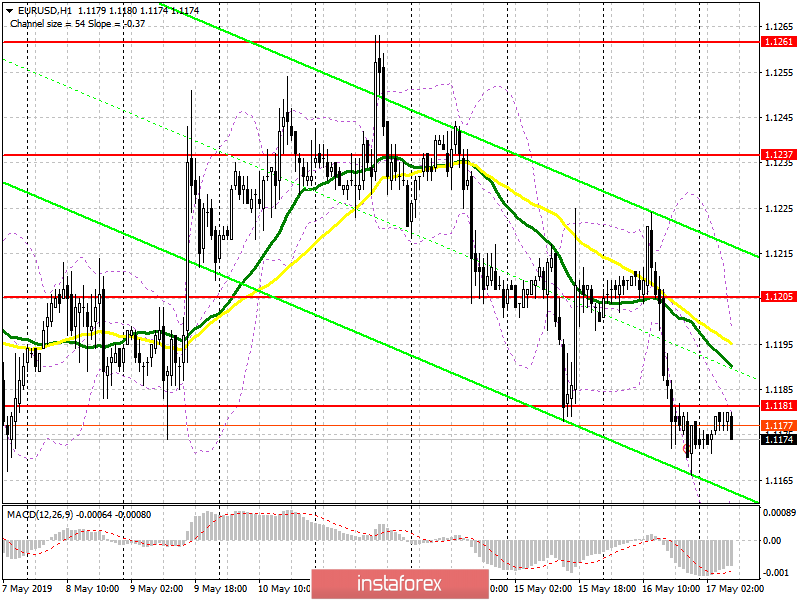
Moving averages
Trade is conducted below 30 and 50 moving averages, which indicates that the euro will likely decline.
Bollinger bands
Volatility is very low. The euro can be supported by the lower boundary of the indicator in the area of 1.1162, while growth will be limited by the upper boundary of the indicator in the area of 1.1195.
Description of indicators
- MA (moving average) 50 days - yellow
- MA (moving average) 30 days - green
- MACD: fast EMA 12, slow EMA 26, SMA 9
- Bollinger Bands 20