
Gold has been trading downwards in past 15 hours, which is potential sign of the selling pressure. The 12h balance was broken on downside and the momentum is bearish. We are expecting downside.
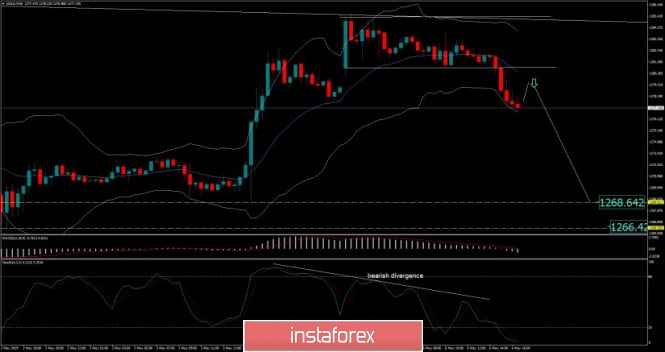
Double white horizontal lines – broken trading range
Blue line – Median Keltner line 20 EMA (current resistance)
Yellow horizontal line – Support
According to the M30 time-frame, we found that there is the bearish divergence on the Stochastic oscillator in the background, which is sign of the weak buyers. Also, there is the fake breakout of the Friday's high at $1.282.56, which is another sign for the potential downward movement. Intraday resistance is seen at the price of $1.280 (Median Keltner EMA and previous low) and at the price of $1.285.70. My advice is to watch for potential selling opportunities on the rallies. The downward objective is set at the price of $1.268.65.
The material has been provided by InstaForex Company - www.instaforex.com