
Gold price has broken through our support levels and reached our lower target in the $1,275-80 area. Last week, we were worried that a break below $1,290 would lead to a test of $1,280 and probably give a new lower low. I was bullish and still remain bullish for the longer term, but the market showed us a decline, so we should protect our longs.
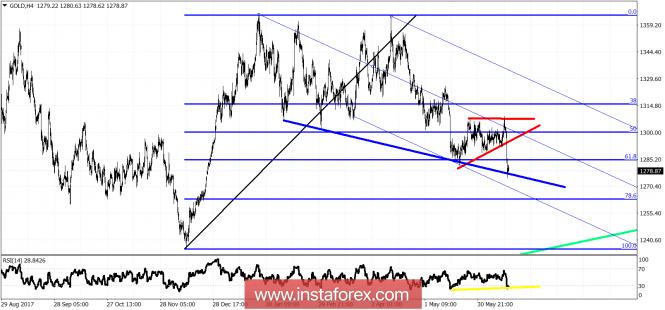
Red line - triangle
Blue line - support
Yellow line - bullish divergence
Gold price in the short-term support is at $1,278 and next at $1,262. The RSI is diverging while the price is marginally below the 61.8% Fibonacci retracement. Last week, once the triangle pattern broke out and Gold got rejected once again at the $1,307-$1,310 area, things were not looking good for Gold. Inability to break the resistance was followed by a rejection and new lower lows. Gold has resistance at $1,295. Only a move above this level could increase the chance of a major low. Longer-term view remains bullish for a move towards $1,400-$1,450.
The material has been provided by InstaForex Company - www.instaforex.com