
Technical outlook:
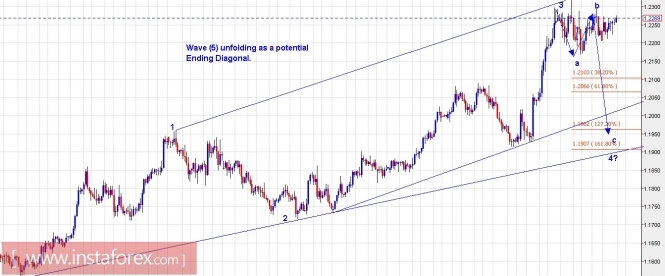
A 4H chart view has been presented for EUR/USD to have a closer look at wave (5), unfolding into its final waves 4 and 5 before terminating. High probable wave count suggests that wave (5) is unfolding as an ending diagonal and is looking to terminate into 4th wave corrective drop towards 1.2060/70 levels or 1.1950 levels respectively. We shall follow the waves closely by selling on rallies for now and then turn bullish for the last leg rally. Initial price support is seen through the 1.1900 handle, also accompanied by an intermediate trend line support as depicted here. At present, the pair is consolidating and intraday rallies should be seen as opportunities to go short. Interim resistance is seen at 1.2323 for now and ideally prices should stay below that. We shall take a close review of price action around the 1.2060 mark to take further directional trade.
Trading plan:
Please remain short for now, stop above 1.2323, target 1.2060 levels at least.
US Dollar Index chart setups:
Technical outlook:
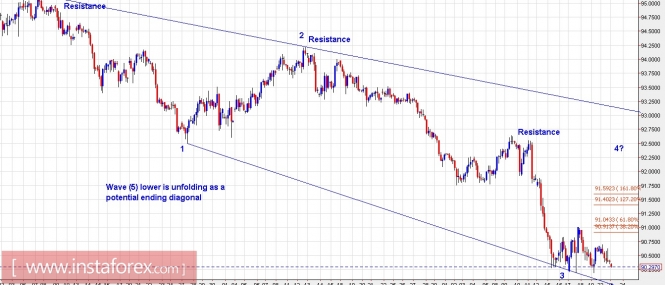
A 4H chart view has been presented here for the US Dollar Index to have a closer look as wave (5) unfolds lower. It seems as an ending diagonal structure unfolding since the 95.10 levels and the index is about to produce a counter trend rally towards wave 4 before collapsing one last time through wave 5 lower. Please note that interim price resistance is seen at 92.60/70 levels and the wave 4 termination point could also be the same. According to the fibonacci extensions, 91.50 level is also a strong probable for wave 4 termination. We shall remain long and buy on intraday dips in anticipation of a wave 4 rally before turning lower towards the 5th wave drop. Any push significantly above the 92.70 resistance will indicate that a meaningful bottom is in place and that the USD Index is set to stage an impressive rally ahead.
Trading plan:
Please remain long for now, stop at 90.00 targeting 91.50 and 92.70.
Good luck!
The material has been provided by InstaForex Company - www.instaforex.com