The theme of Wednesday's Asian session is a sudden drop in USD/JPY in the absence of justification. The rest of the FX market remains calm. EUR/USD drifting close to 1.1930, GBP/USD last hour spent at 1.3530.The stock market is also dominated by stabilization. However, Crude Oil makes another high.
On Wednesday, 10th of January, the event calendar is busy with important news releases. Important data will be released from France (Industrial Production), UK (Industrial Production, Manufacturing Production, Trade balance, NIESR GDP Estimate), Canada (Building Permits) and the US (Import Price Index, Wholesale Inventories Crude Oil Inventories).
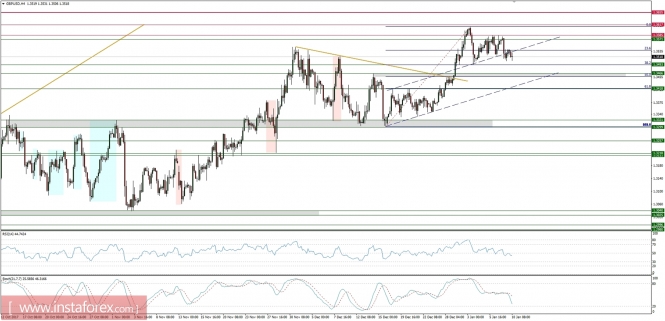
GBP/USD analysis for 10/01/2018:
The most important data for today will be released from the UK. The Visible Trade Balance is expected to remain unchanged at -10bln Pound, Manufacturing Production is expected to increase from 0.1% to 0.3% on monthly basis, Industrial Production is expected to increase as well from 0.0% to 0.4% this month and NIESR GDP Estimate ( an unofficial estimate of UK GDP that comes out one month before the official release) is expected to remain unchanged at 0.5% level. In conclusion, positive data from the UK economy are expected, so if there is no surprise, GBP should appreciate a little across the board after the data are released.
Let's now take a look at the GBP/USD technical picture at the H4 time frame. The price got back under the main channel (dashed blue) around the level of 1.3518. The nearest support is seen at the level of 1.3493 (38% Fibo), but the price might break it and drop towards the level of 1.3446, which is much stronger support zone. The momentum is pointing down and so is the stochastic indicator. In a case of a further rally upwards, the nearest technical resistance is seen at the level of 1.3585.
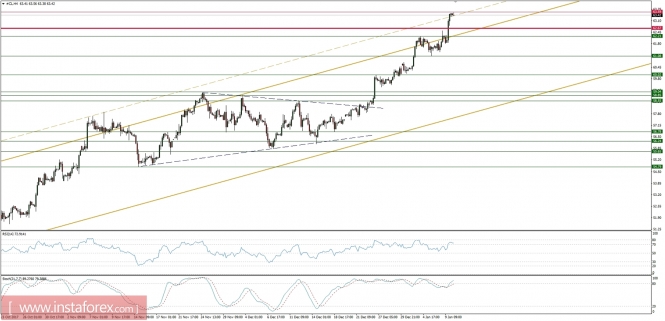
Market Snapshot: Crude Oil makes a new high.
The price of Crude Oil has made another higher high as it broke through the resistance at the level of 62.67. The current high is at the level of 63.51 (at the moment of writing) and it hit a dashed channel line resistance.The market conditions are overbought at this time frame and there is a clear bearish divergence between the price and momentum oscillator, so the pull-back towards the level of 62.67 is expected.
Market Snapshot: DXY fails to break out higher.
The price of US Dollar Index (DXY) has failed to break out above the technical resistance at the level of 92.67 and reversed towards the support line at the level of 92.27 in overbought market conditions. In a case of a further drop, the next technical support is seen at the level of 91.75.