The Asian part of the session was under influence of a sudden USD/JPY collapse. AUD has been supported by good economic data, so NZD followed it, as it usually does. The Euro remains on the defensive, but the stock market is still growing, noting more highs. Crude oil remains high as well.
On Tuesday 9th of January, the event calendar is light in important data releases, but the market participants will keep an eye on German Trader Balance data, Italian and Swiss Unemployment Rate data, Canadian Housing Starts data and JOLTs Job Openings data from the US.
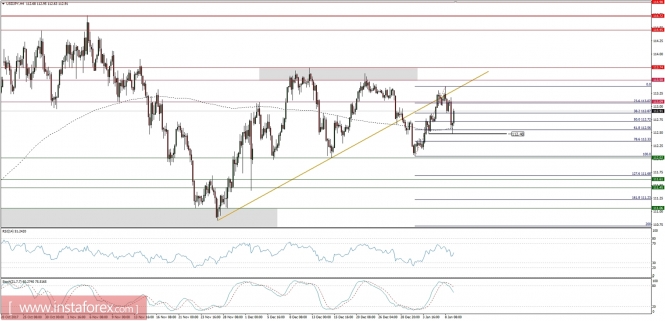
USD/JPY analysis for 09/01/2018:
A sudden jump in the Yen is probably a reaction of investors to the decision of the Bank of Japan to reduce the volume of purchased government bonds on cyclical auctions. At a weekly auction, the BoJ offered to buy securities with a maturity of 10-25 years and over 25 years by 10 billion JPY less than at the auction at the end of December. The market began to speculate about the bank's future departure from ultra-loose policy, although BoJ aims at bringing inflation to the 2% target anyway.
Let's now take a look at the USD/JPY technical picture at the H4 time frame. The price dropped to the technical support at the level of 112.48, just below 61% Fibo retracements at the level of 112.56 and currently is bouncing towards the technical resistance at the level of 113.09. The price remains locked in a horizontal area between the levels of 112.02 - 113.45 and as long as either of this level is not clearly violated, the trend remains neutral.
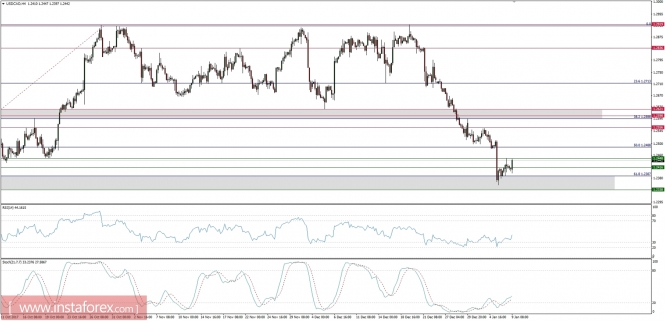
Market Snapshot: USD/CAD bounces from 61% Fibo
The price of USD/CAD had bounced from the level of 1.2355, which is just below the 61% Fibo retracements of the previous swing up at the level of 1.2387. Currently, the price is testing the internal resistance at the level of 1.2448 and if bull will be strong enough to break out above this level, then the next target is seen at the level of 1.2488. Oversold market conditions support the view.
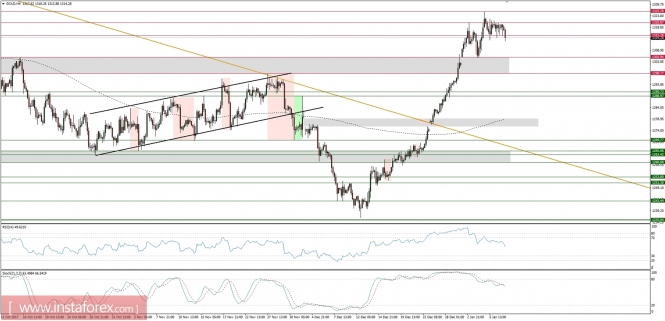
Market Snapshot: GOLD breaking to the downside?
After making the swing high at the level of $1,325, the price of GOLD was moving in a sideways correction zone established between the levels of $1,320 - 1,313. Nevertheless, growing bearish divergence between the price and momentum oscillator is now triggering the bearish price action as the GOLD starts to violate the support. In a case of a further drop, the nearest support is seen at the level of $1,305.